|

|
|
|
|
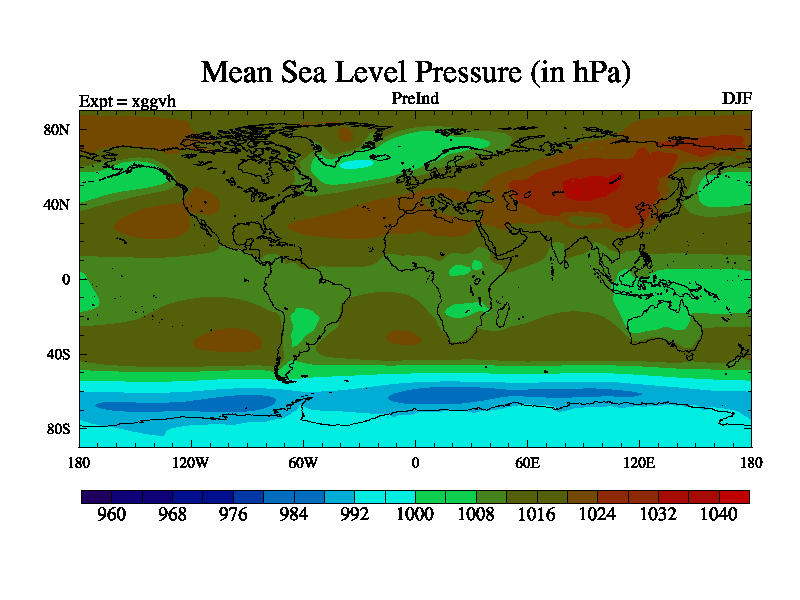
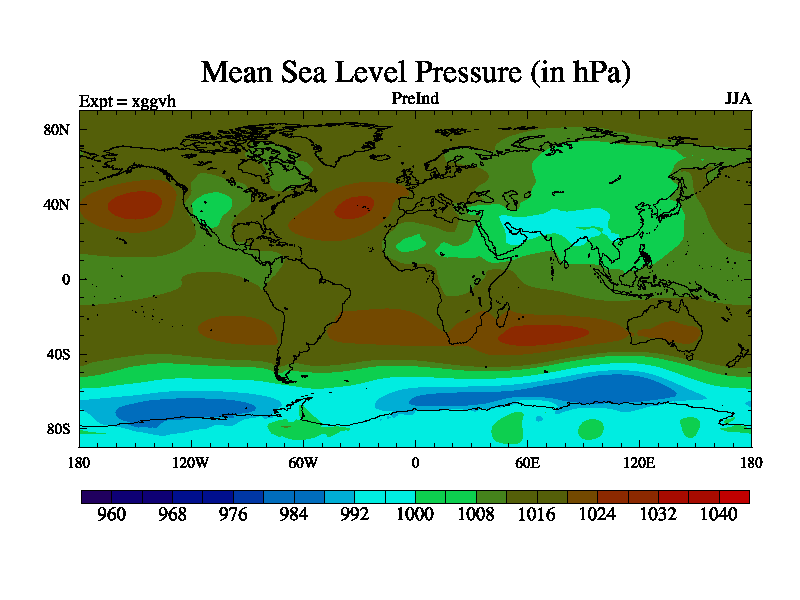
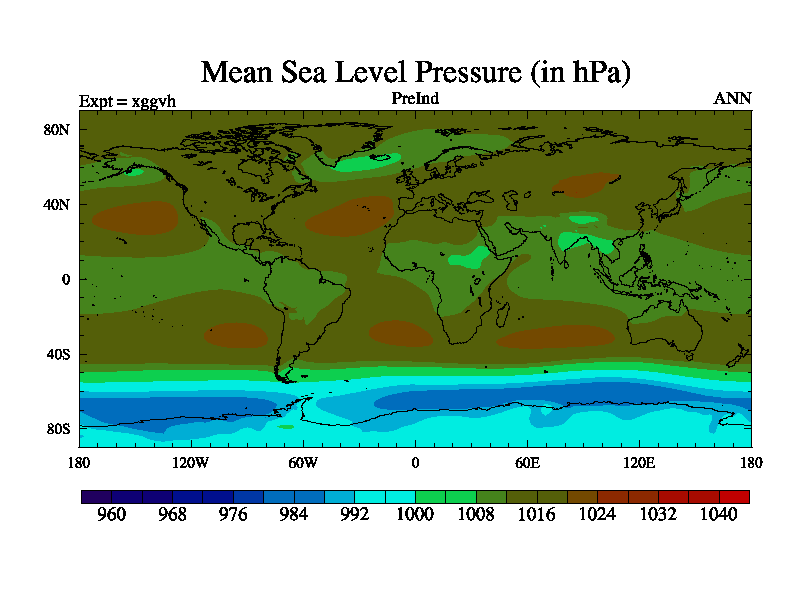
Earth Systems Modelling Results
Bristol Research Initiative for the Dynamic Global
Environment with the University of Reading, Open University, and the British Antarctic Survey.
|
Model Simulations
Experiment: xggvh
|
|
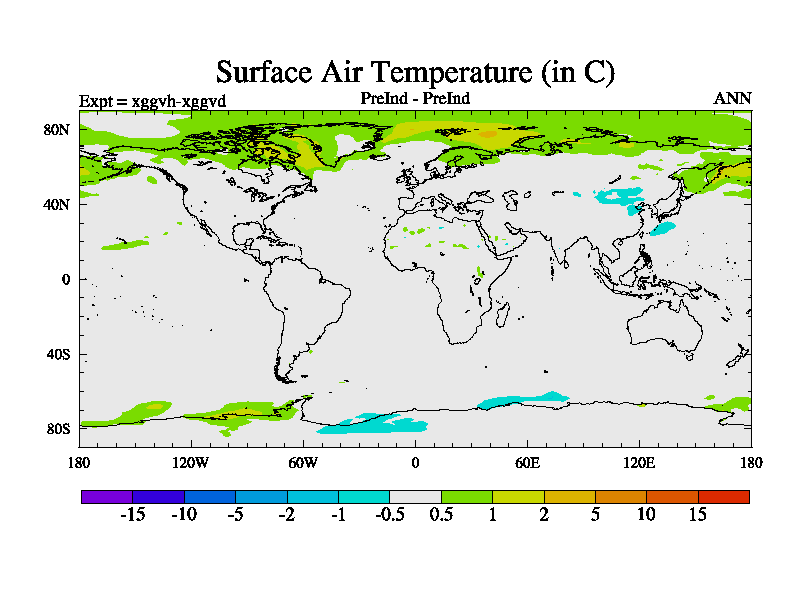
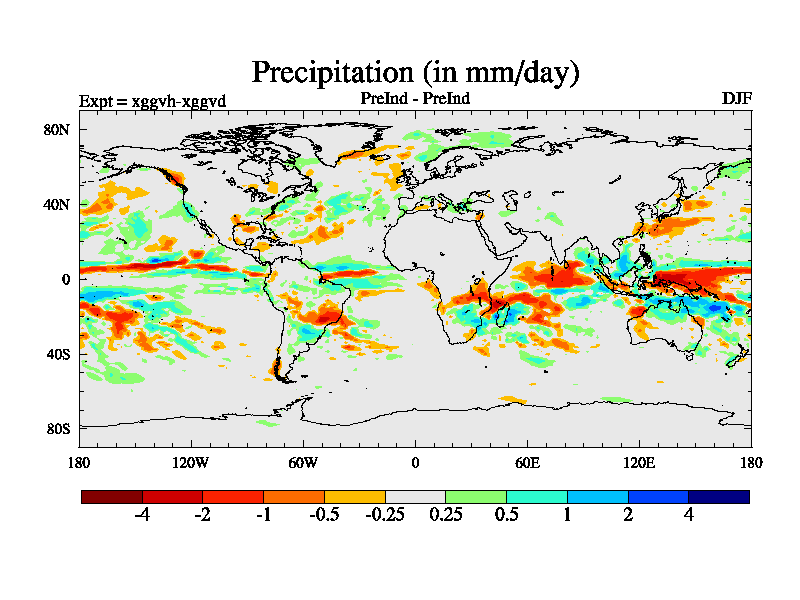
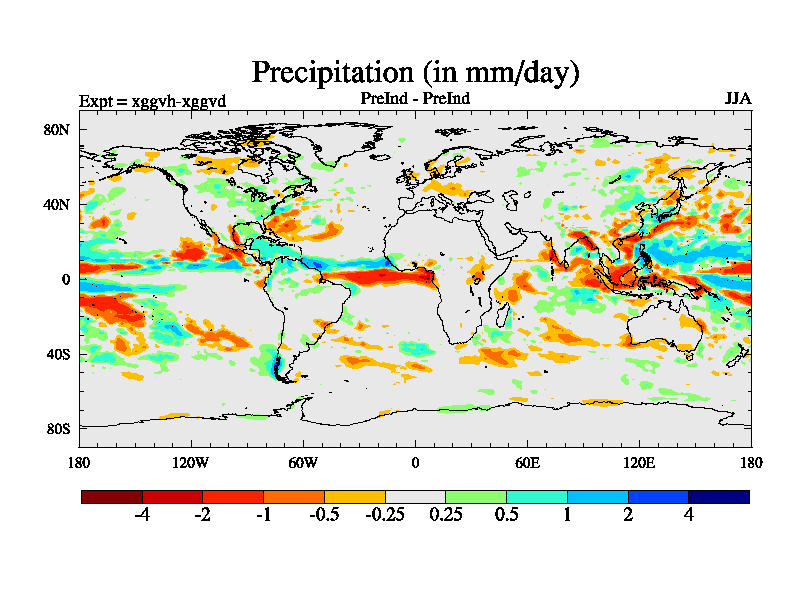
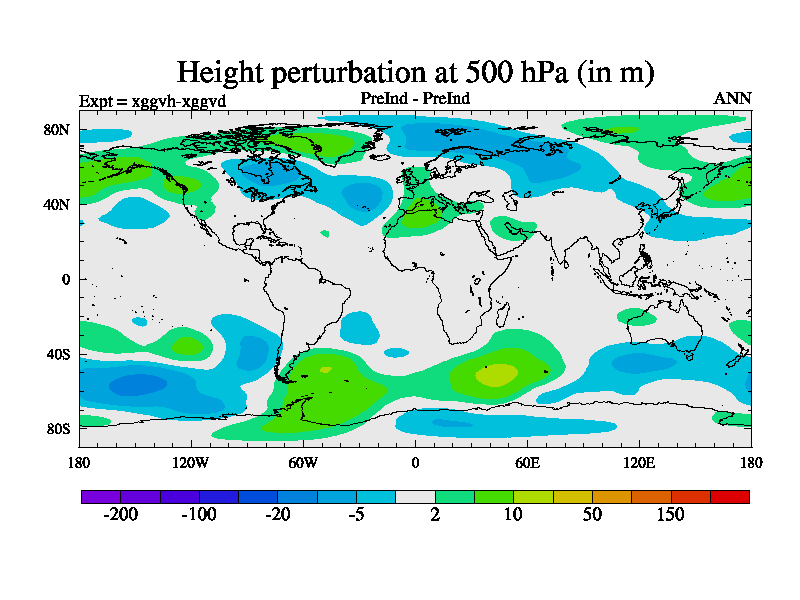
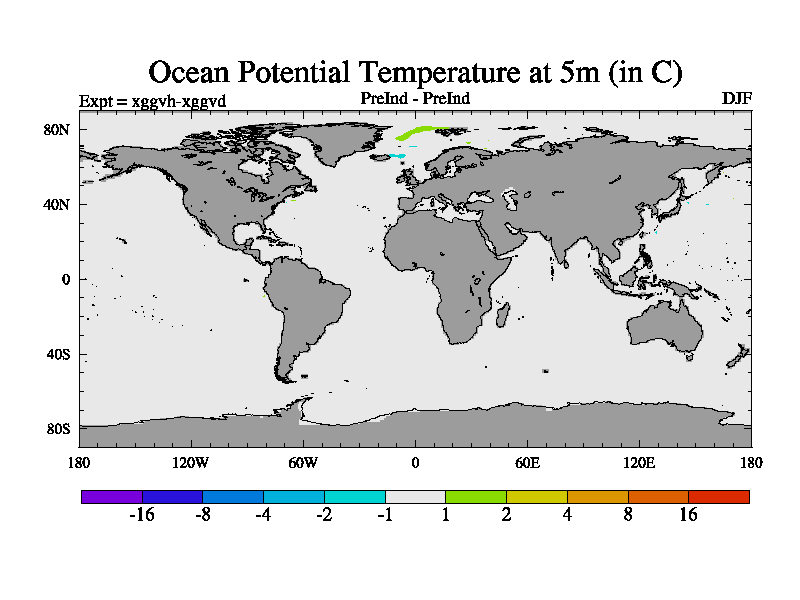
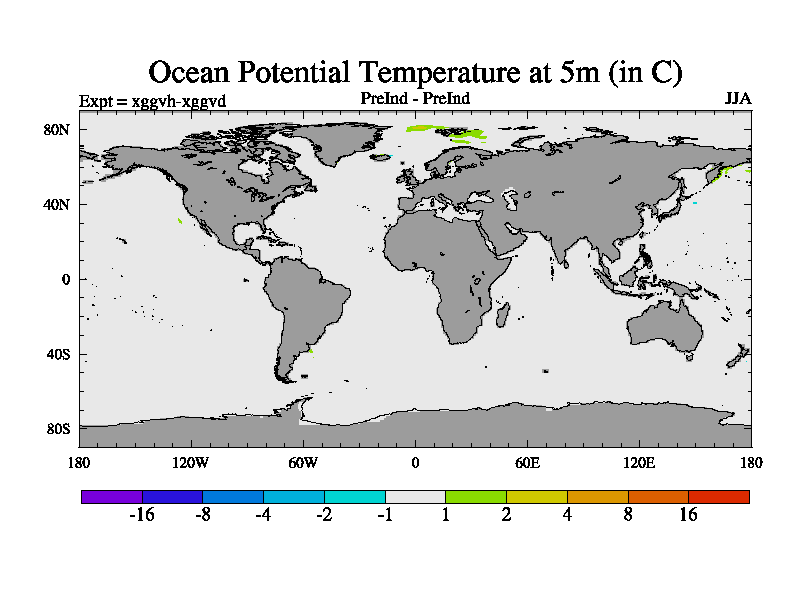
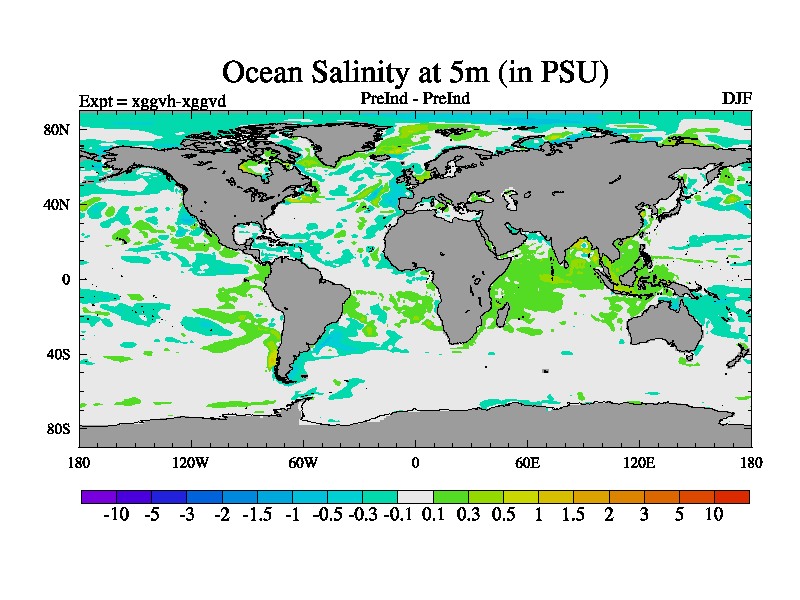
This simulation was run for 30 years after the upgrade to HECTOR phase3. It is setup identically to xggvd which was previously run for 20years on phase2b.
|
| Brief Description |
Fuller Description |
Total Length of Run (in years) |
Averaging period (in years) |
Spinup period (in years) |
CO2 (in ppmv) |
CH4 (in ppbv) |
N2O (in ppbv) |
CFC11 (in pptv) |
CFC12 (in pptv) |
Computer used for simulation |
Compiler used for simulation |
Date of first entry in datebase |
Date of most recent modification to entry in database |
| HadGEM2ES |
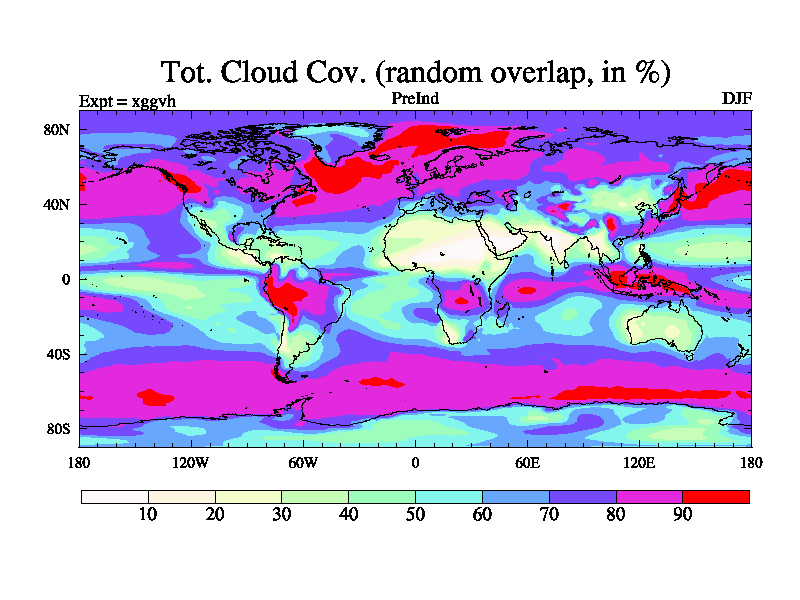
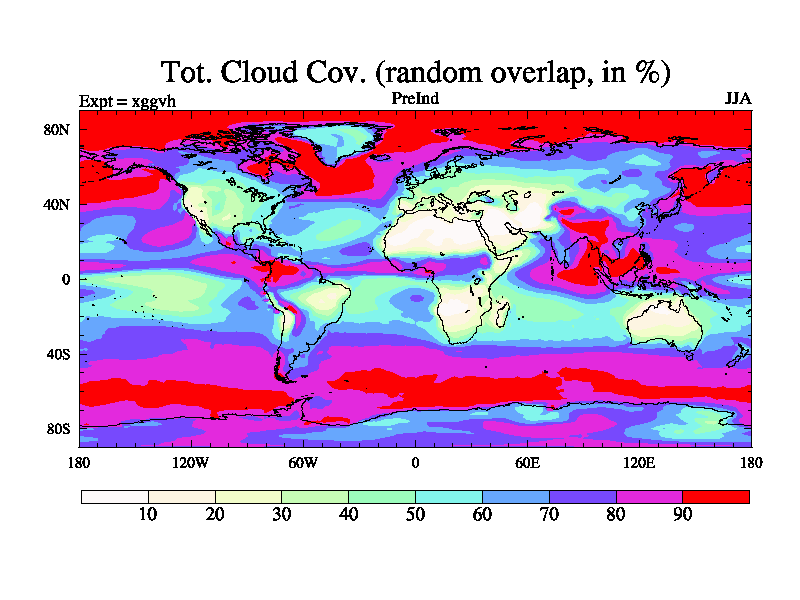
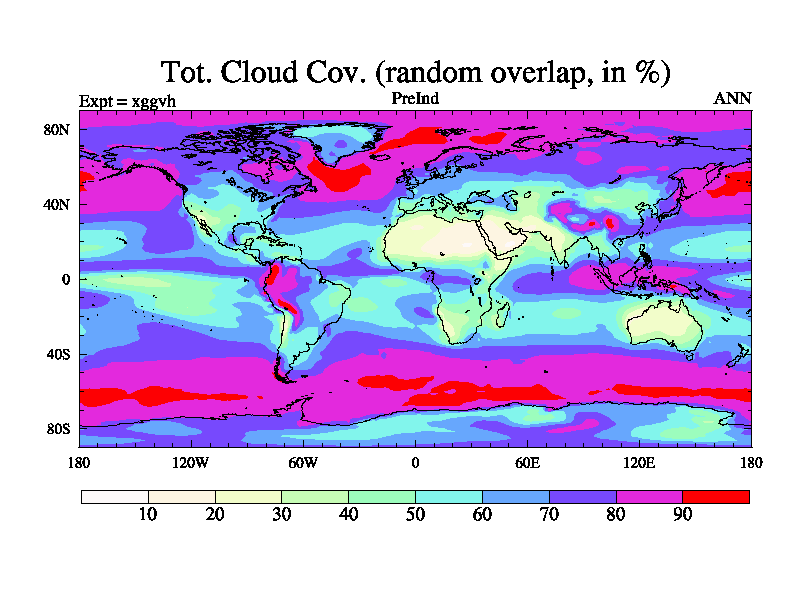
20 continuation of the NCAS agada job, nominally the same as the CMIP5 HadGEM2-ES pre-industrial coupled Earth System model run. All boundary conditions are constant in time and this includes for example, vegetation disturbance and aerosol and chemistry emissions, specifically CH4 is fixed in the chemistry model to the prescribed surface concentration. Interactive dynamic vegetation is on. |
30 |
30 |
0 |
286 |
805 |
276 |
0 |
0 |
unknown |
unknown |
2012_05_27_12_12 |
2013_06_04_11_00 |
| You can access the means from this run, by going here |
| You can access the ocean integrals from this run, by going here |
|
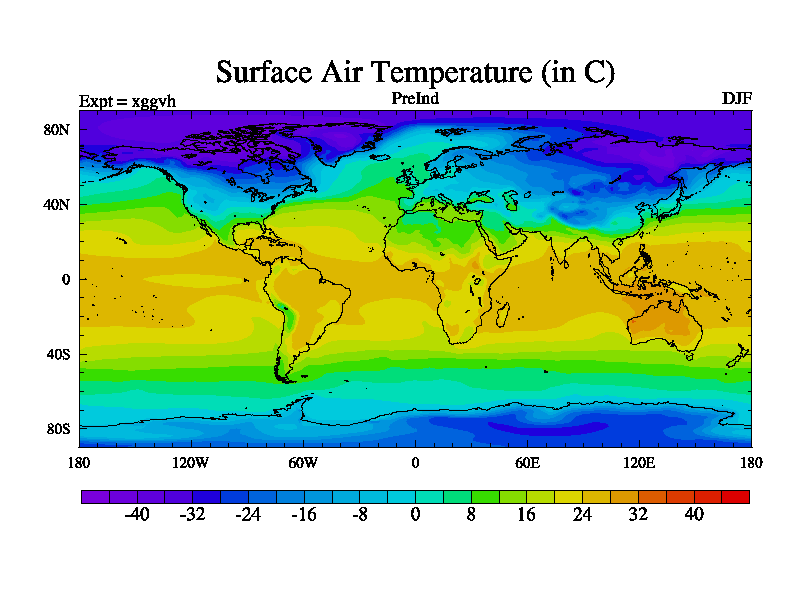
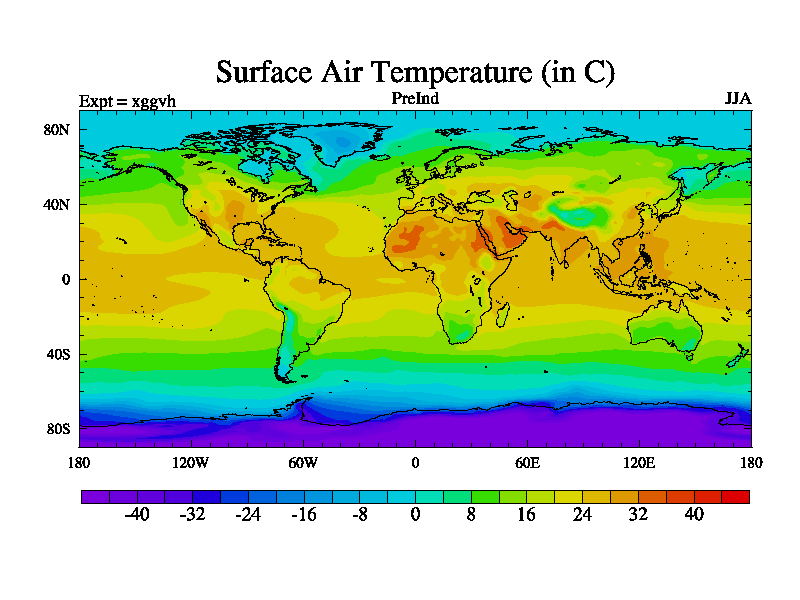
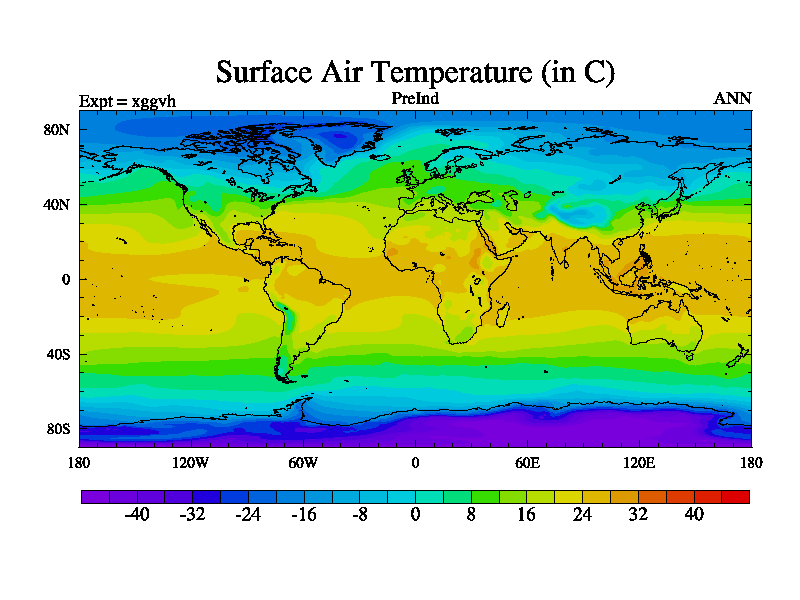
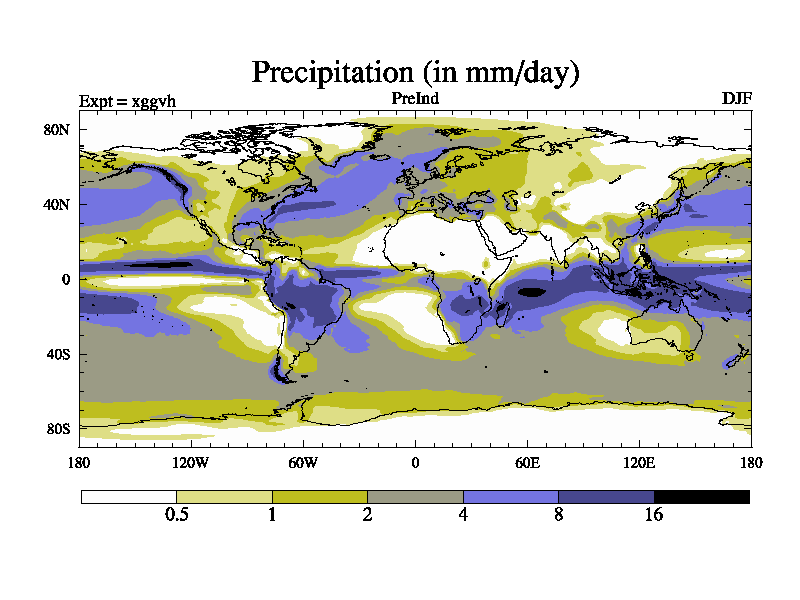
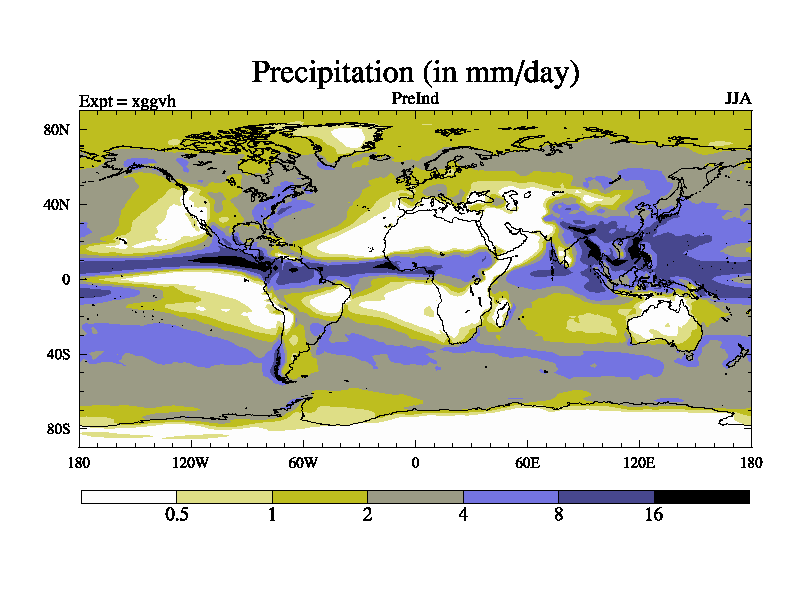
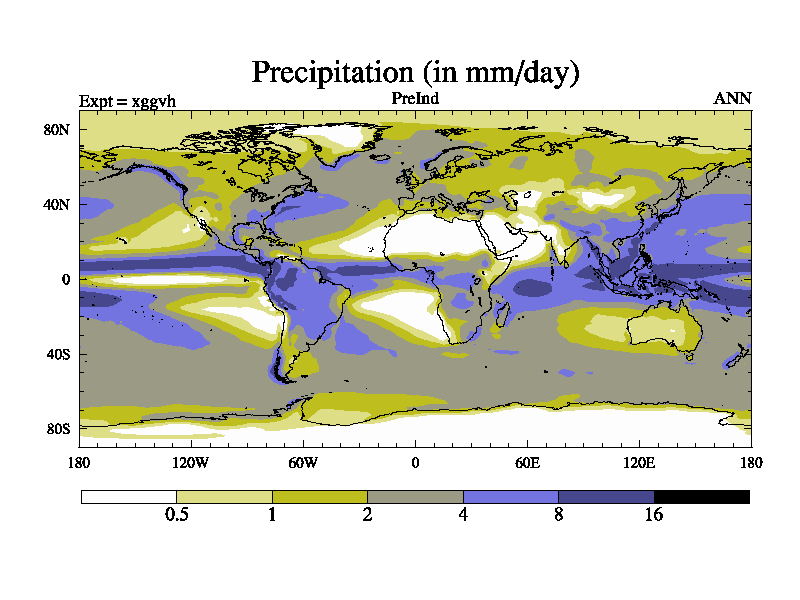
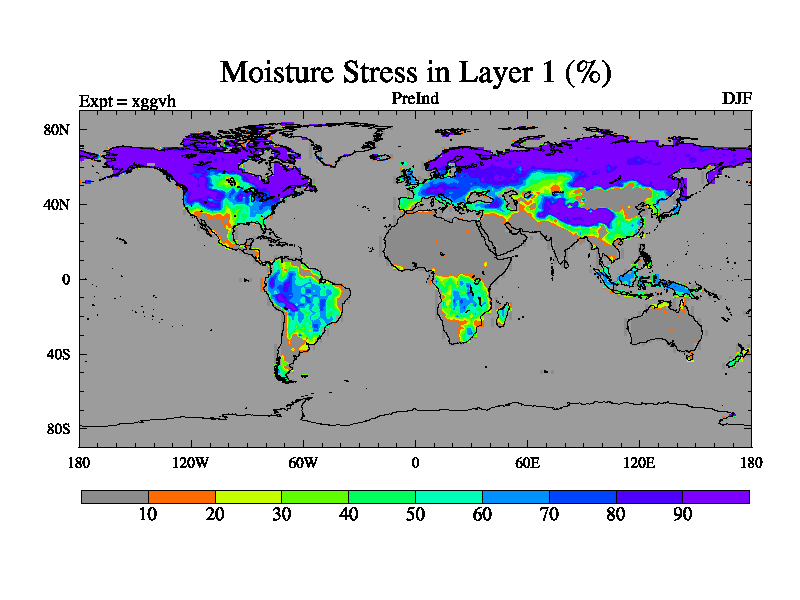
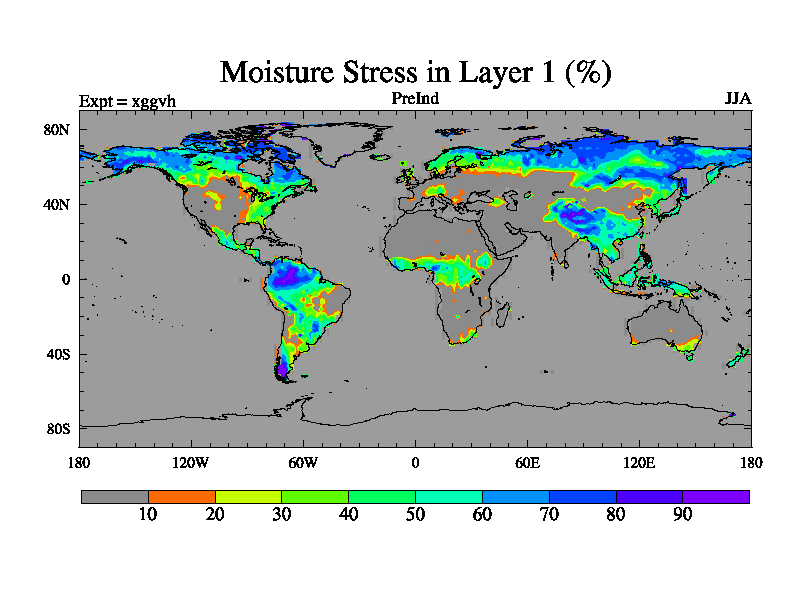
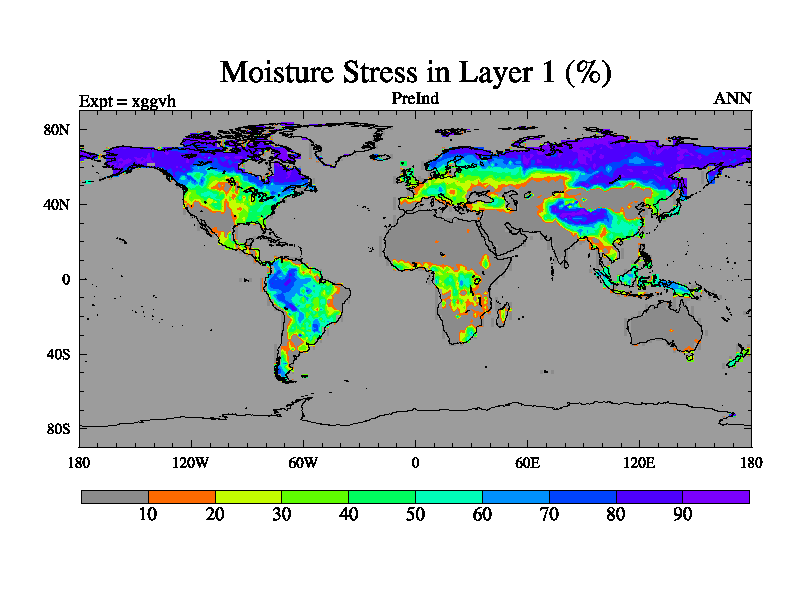
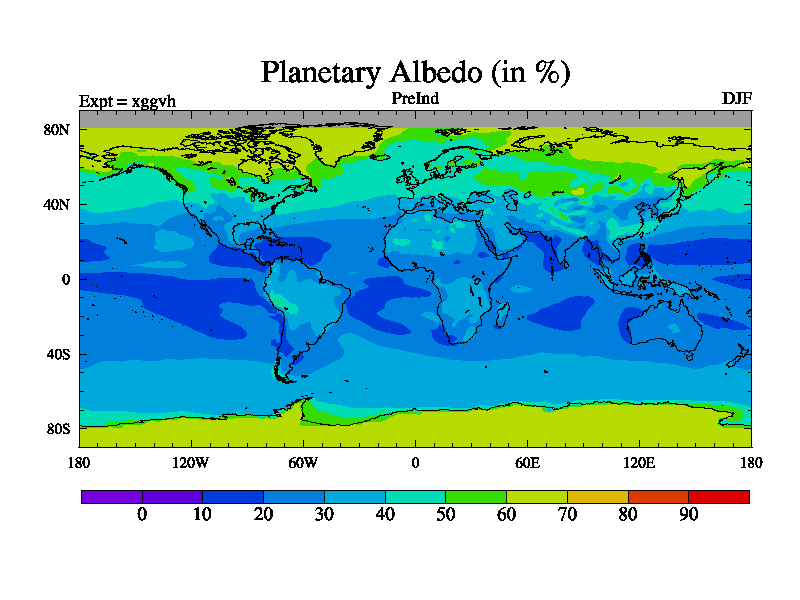
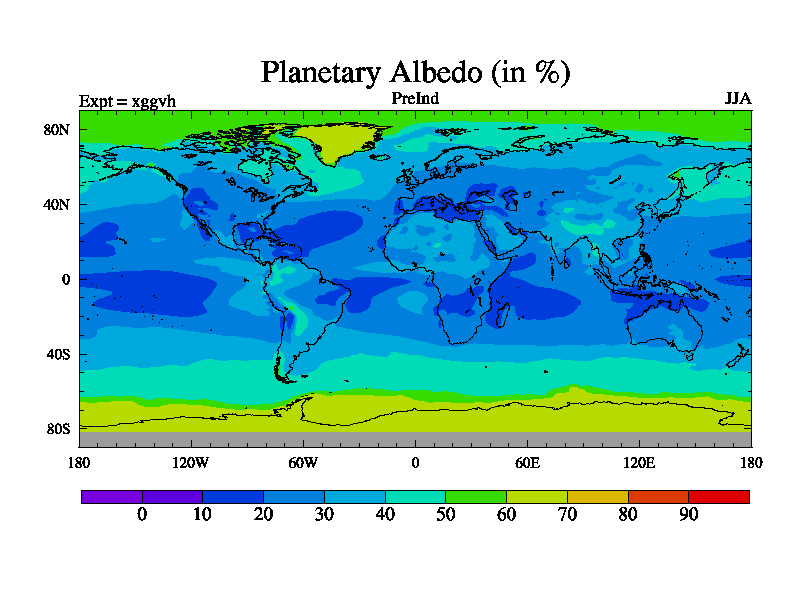
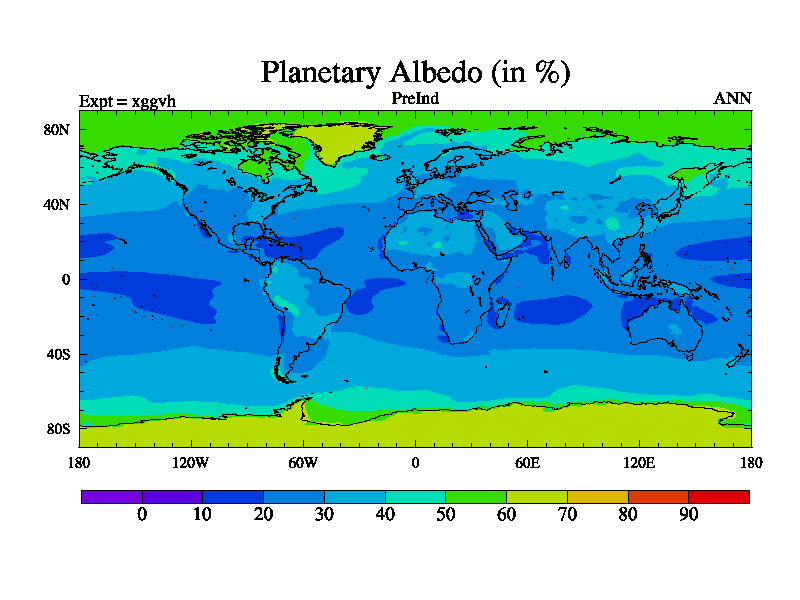
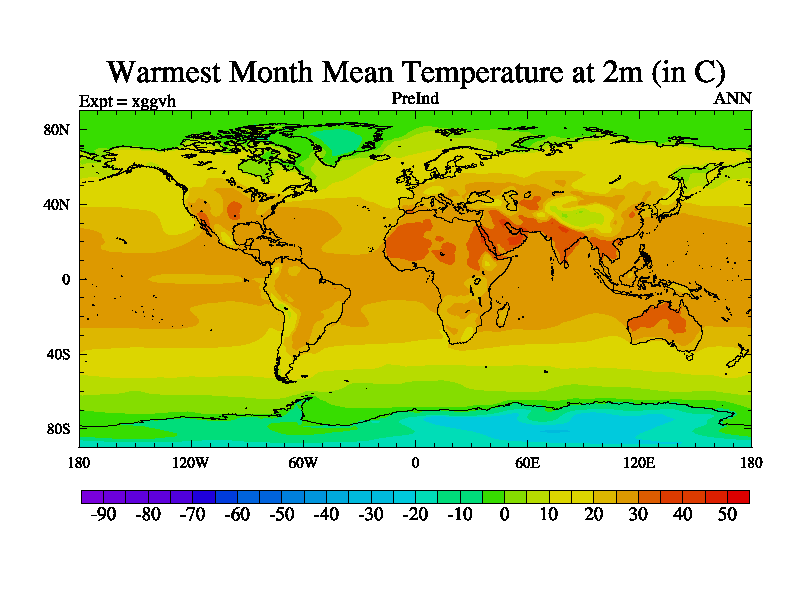
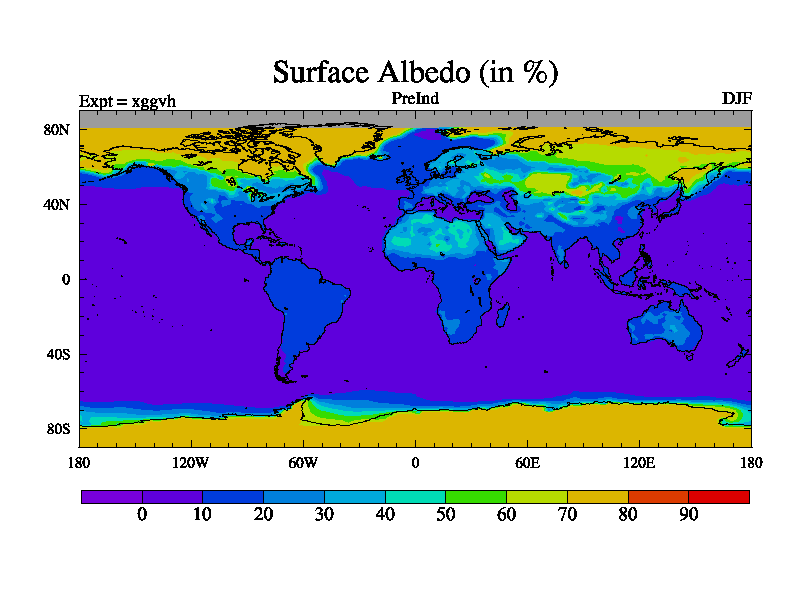
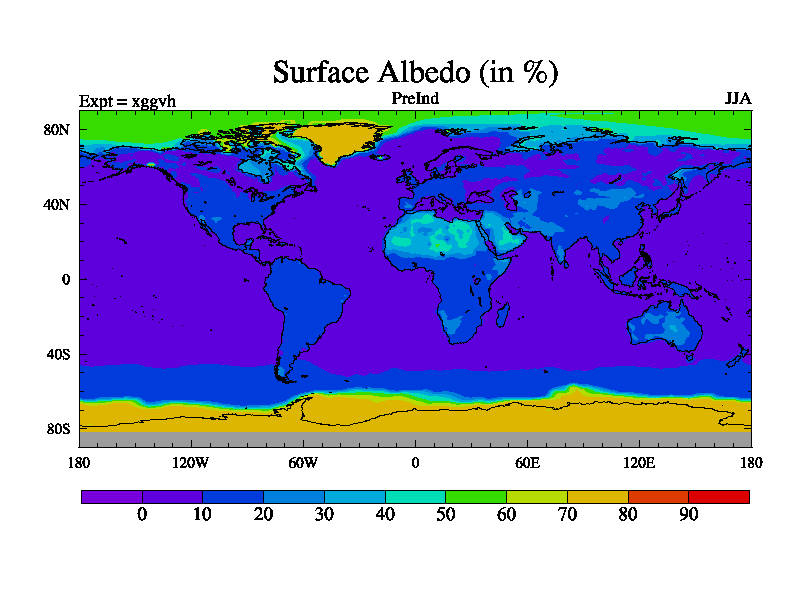
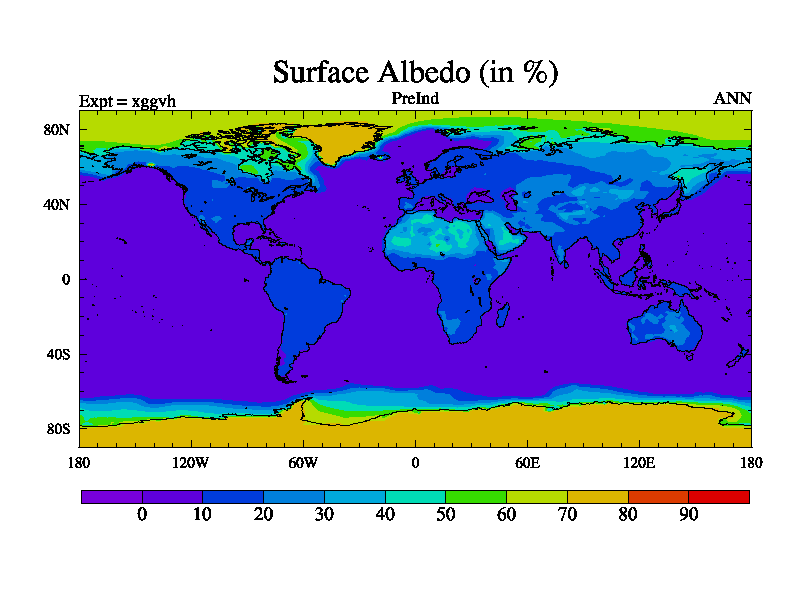
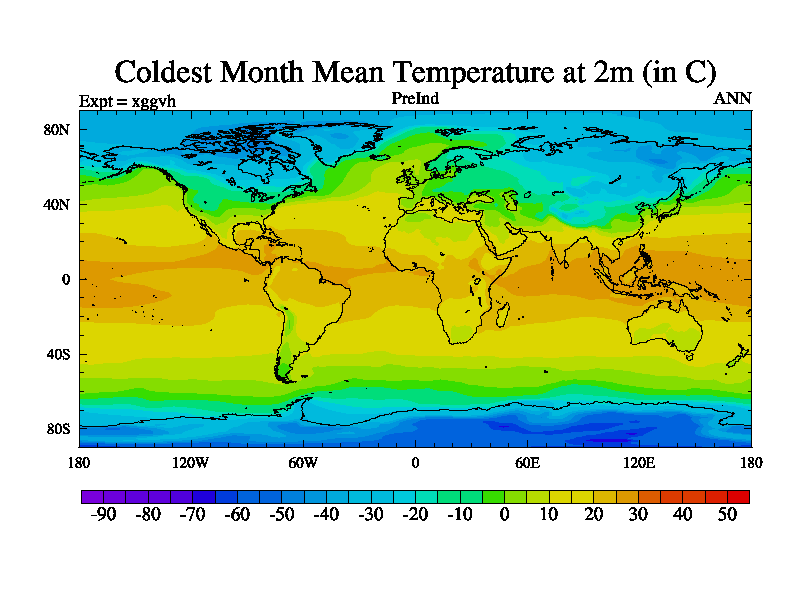
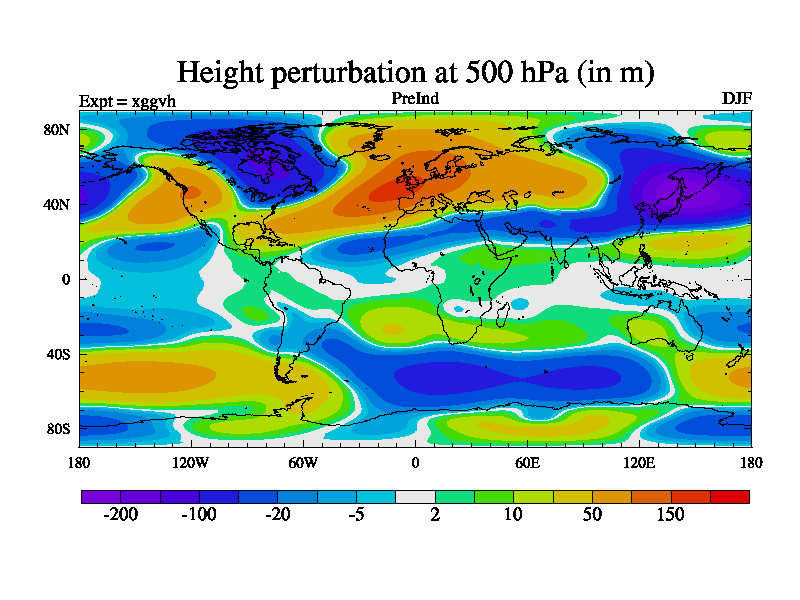
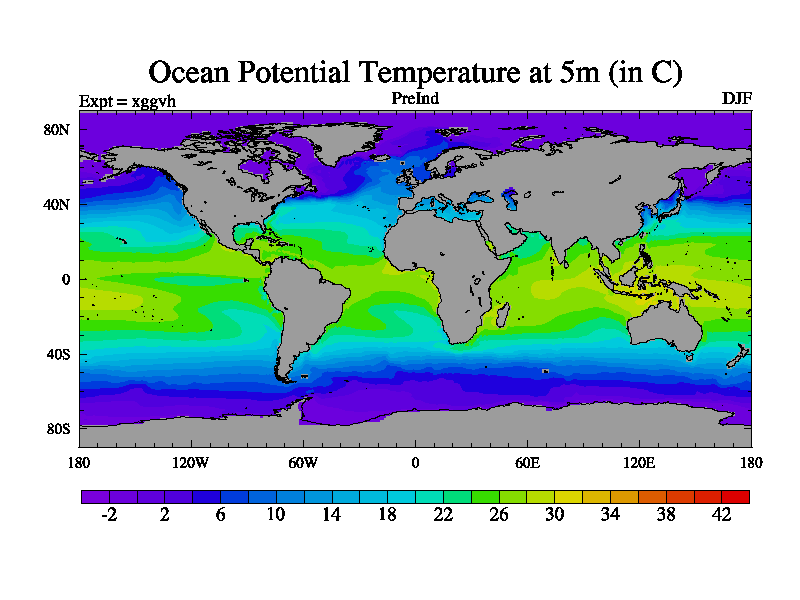
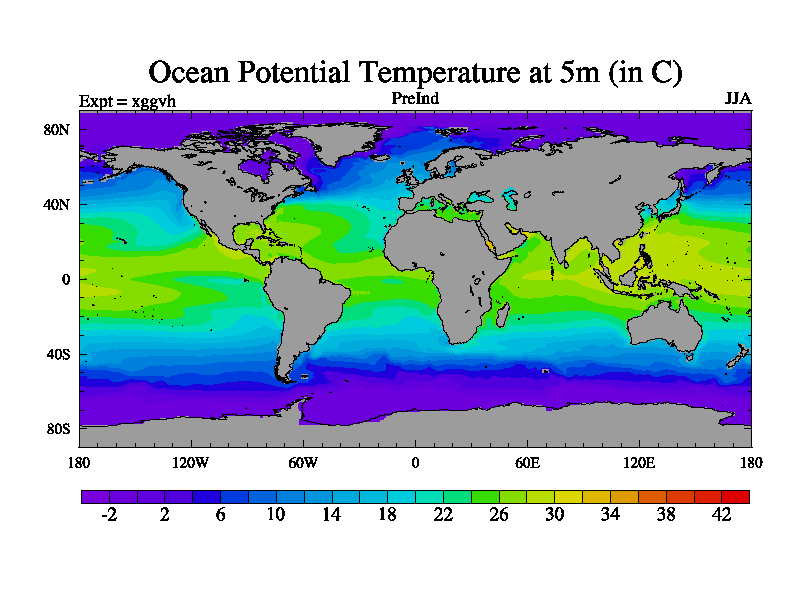
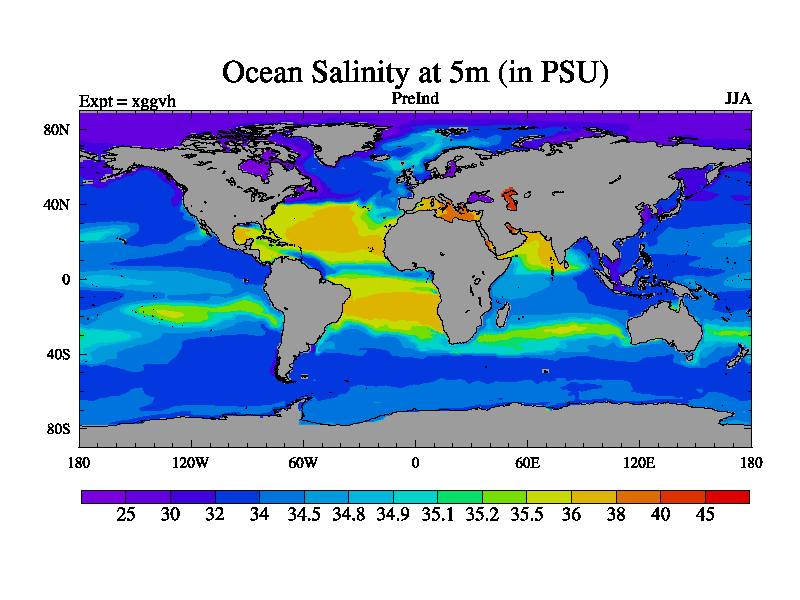
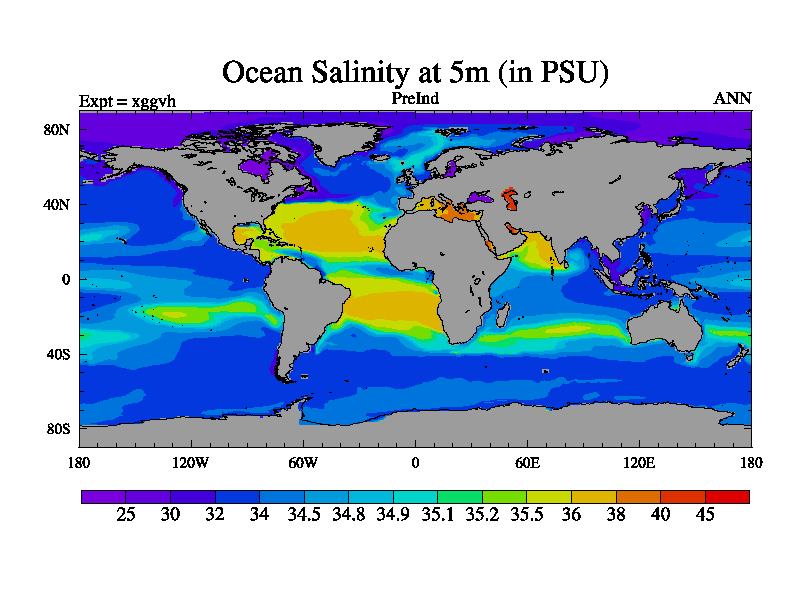
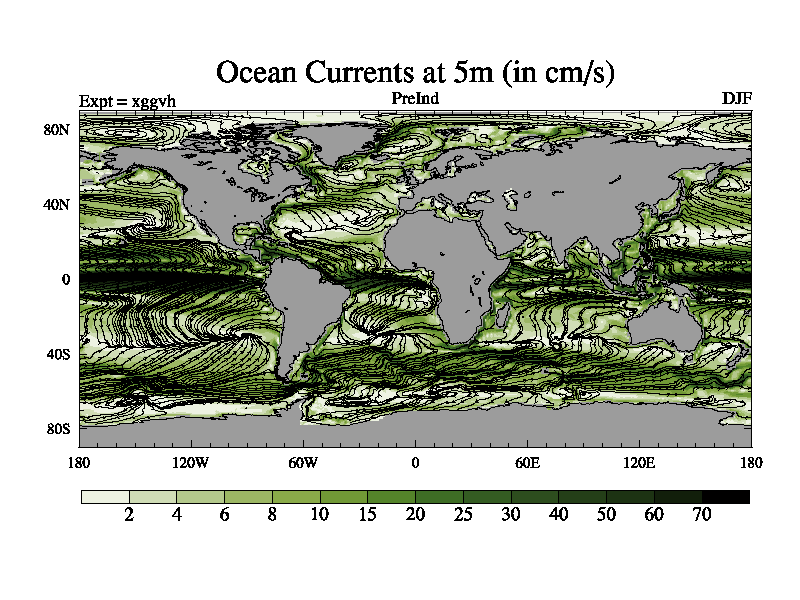
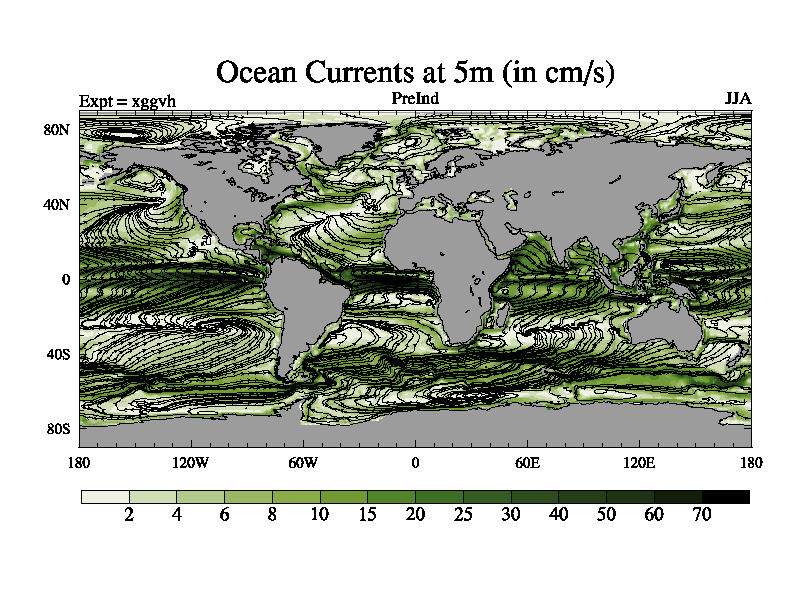
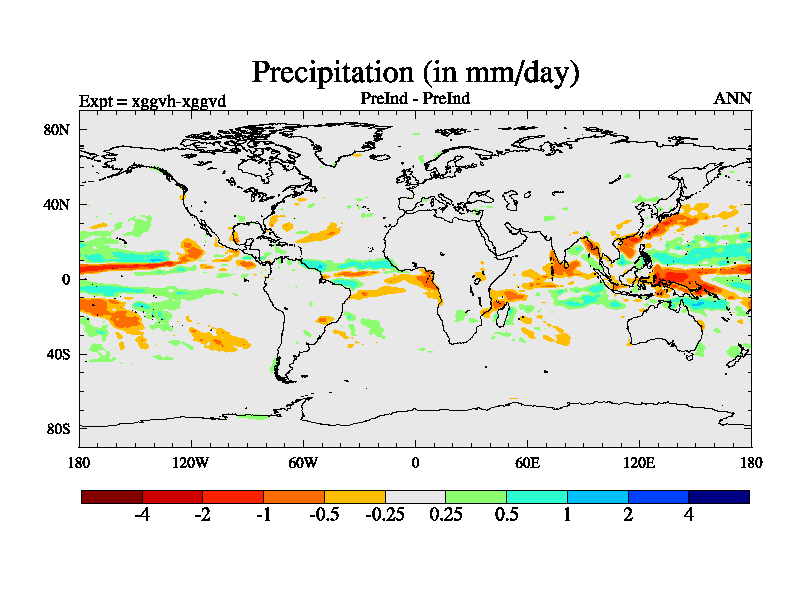
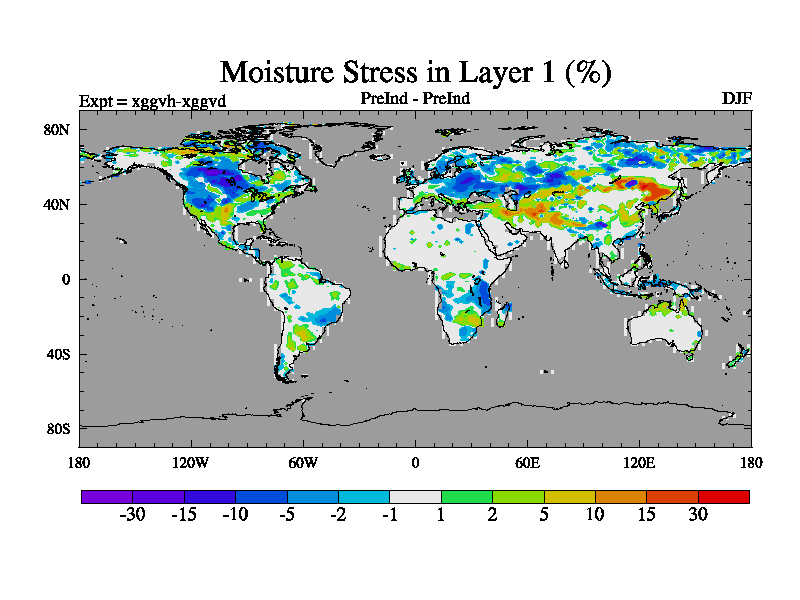
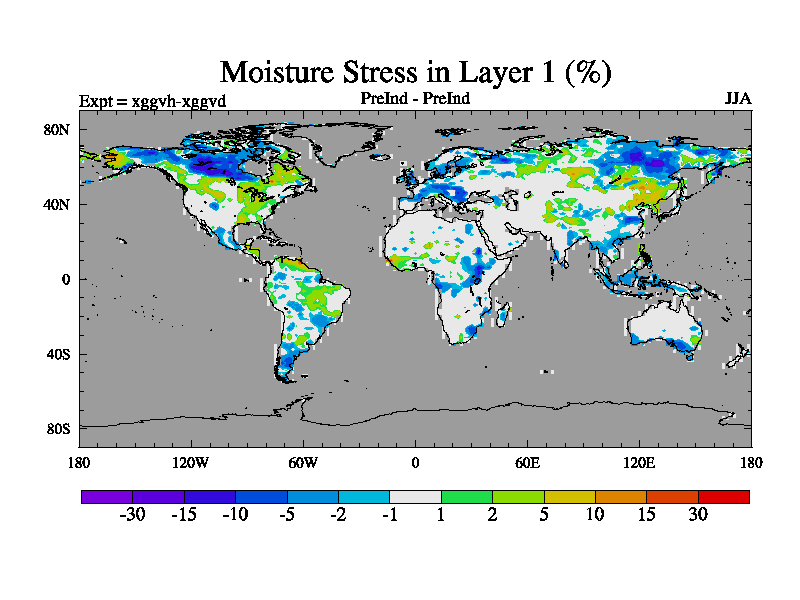
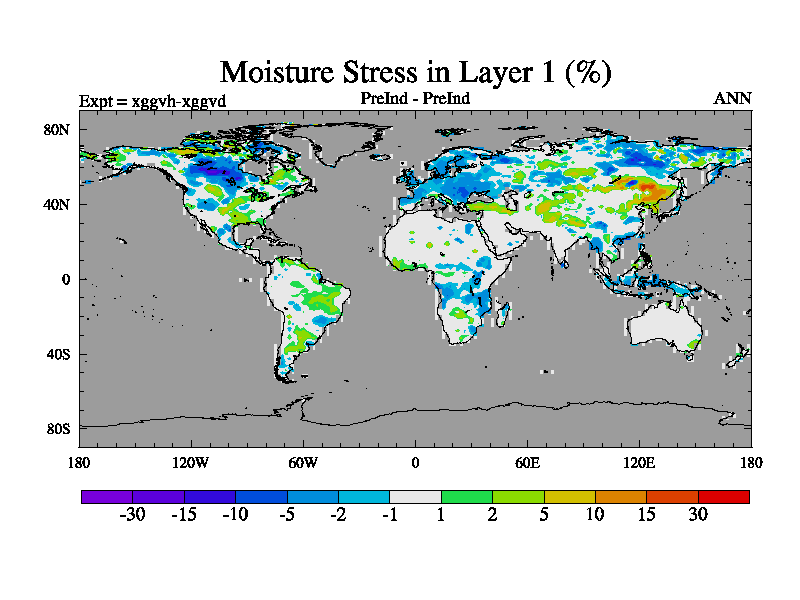
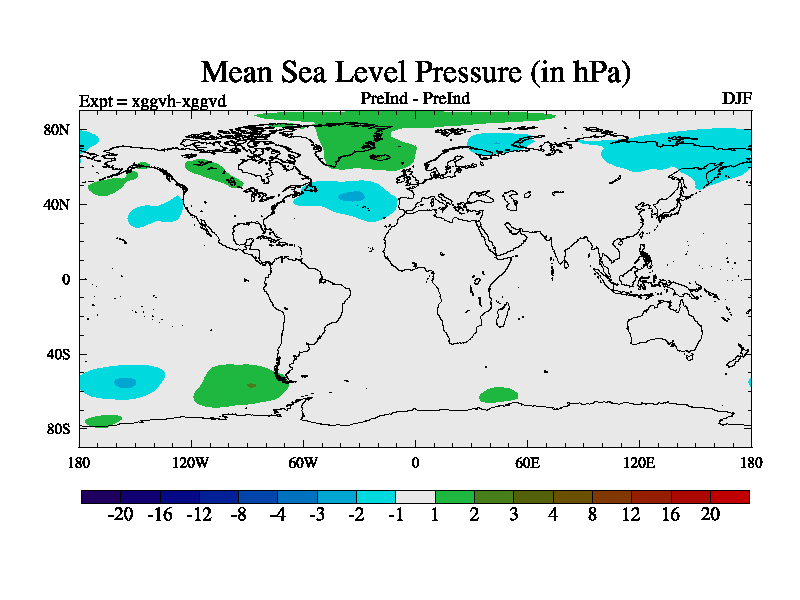
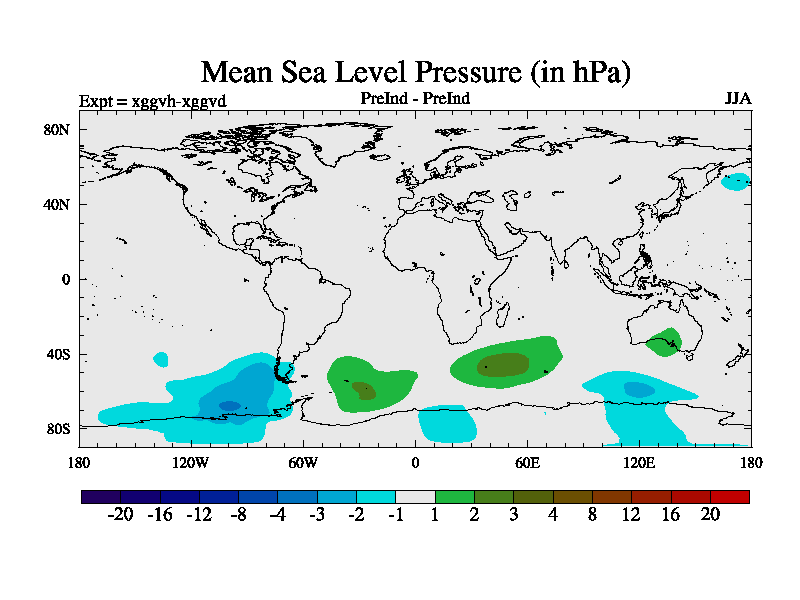
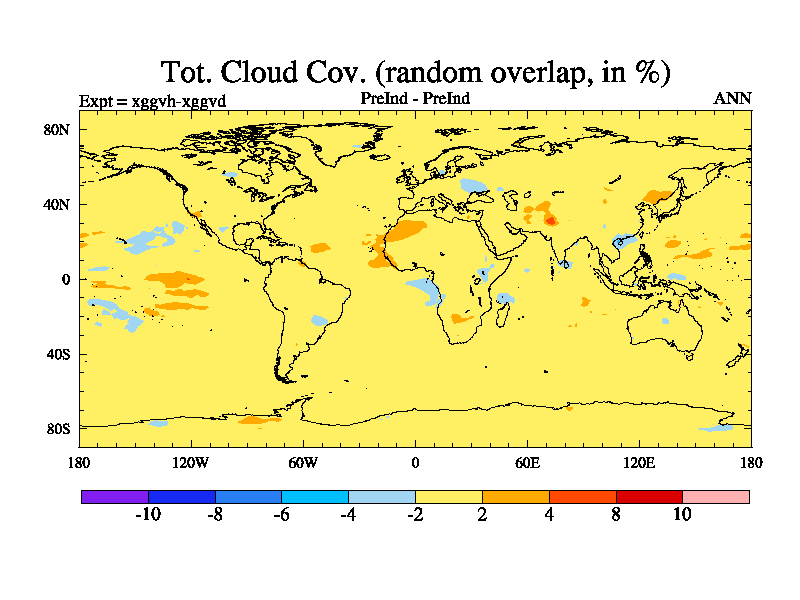
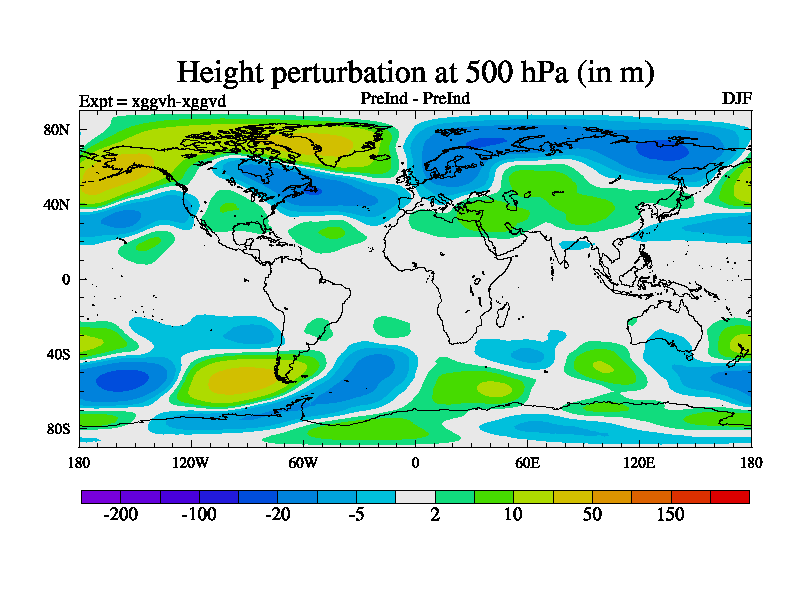
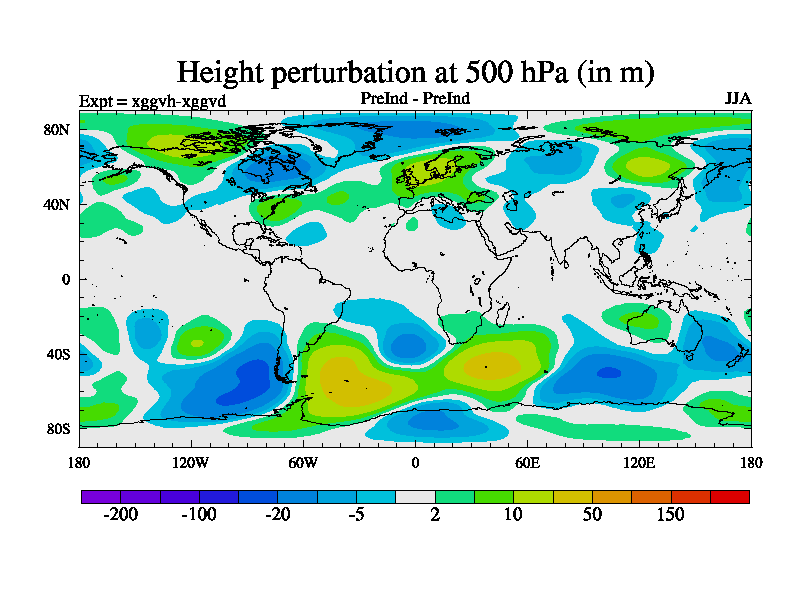
This page shows a small subset of images from this simulation. They have
already been produced and there are no optional choices. If you want to do a
more detailed examination of the model results, you can go to the
main page and select one of the Parts. This will give you full access the system
|
|