Bristol Research Initiative for the Dynamic Global
Environment
with the
University of Reading, Open University, and the British Antarctic Survey.
Model Simulations
Experiment: tdluv
A long description of this run is currently not available
Brief Description
Fuller Description
Total Length of Run (in years)
Averaging period (in years)
Spinup period (in years)
CO2 (in ppmv)
CH4 (in ppbv)
N2O (in ppbv)
CFC11 (in pptv)
CFC12 (in pptv)
Computer used for simulation
Compiler used for simulation
Date of first entry in datebase
Date of most recent modification to entry in database
GETECH_Rupalian_4_new
This is the Rupalian version of Phase 4 of the GETECH simulations. Continuation of 'tdlun' Phase 4 with baratropic stream function turned on BUT with 2xCO2 for complete 1000 year run. WITH CORRECT ANTARCTICA DEFINITION.
1000
30
970
1120
760
270
0
0
bigblue
Intel_v10.1
2017_02_01_15_39
2017_02_01_15_40
You can access the means from this run, by going here
You can access the ocean integrals from this run, by going here
This page shows a small subset of images from this simulation. They have
already been produced and there are no optional choices. If you want to do a
more detailed examination of the model results, you can go to the
main page and select one of the Parts. This will give you full access the system
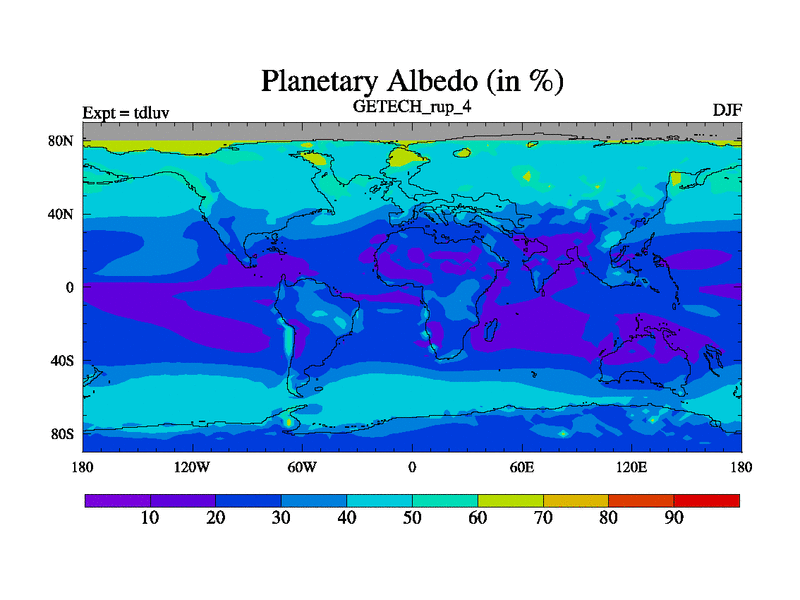
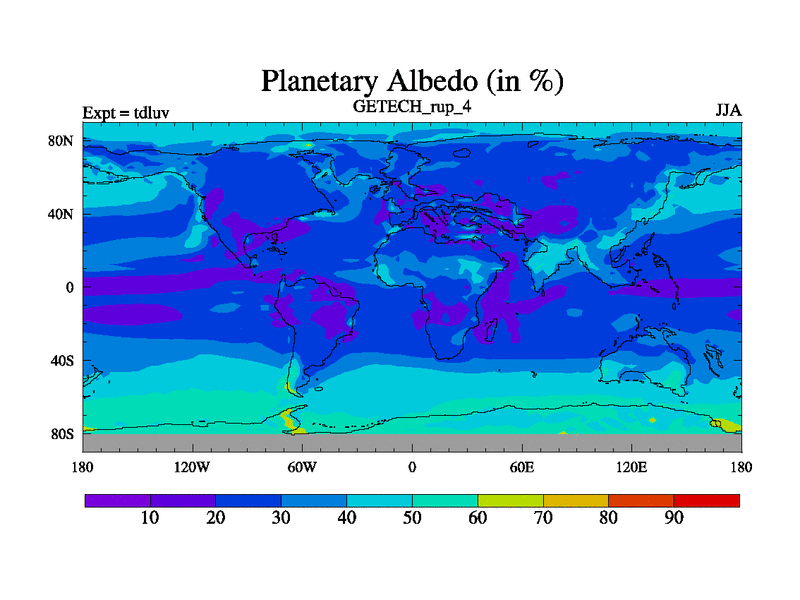
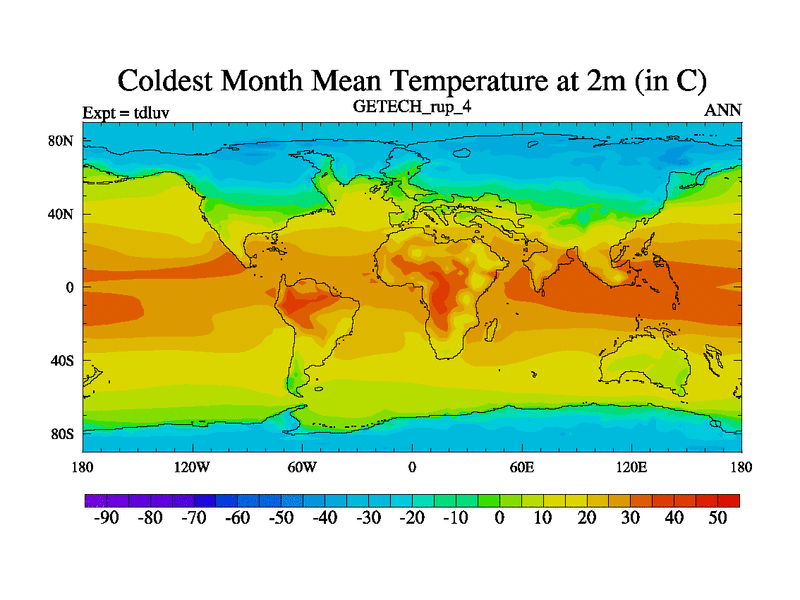
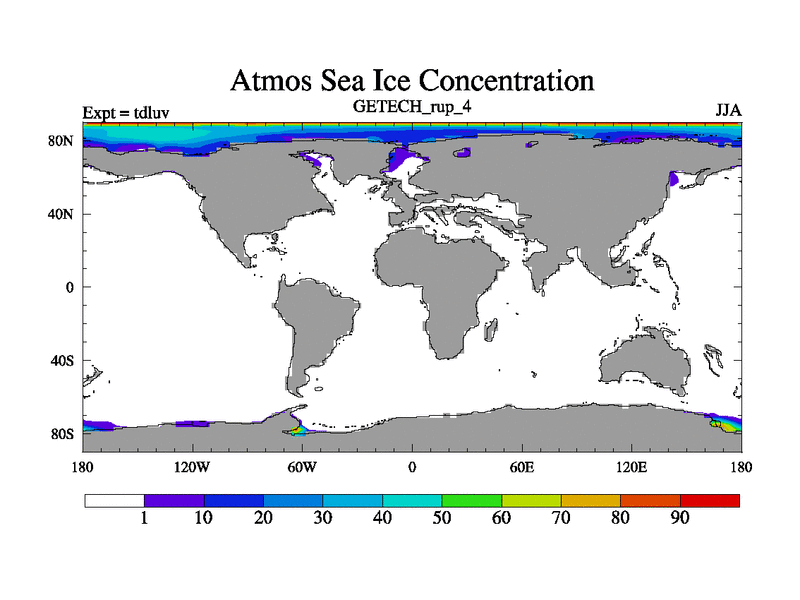
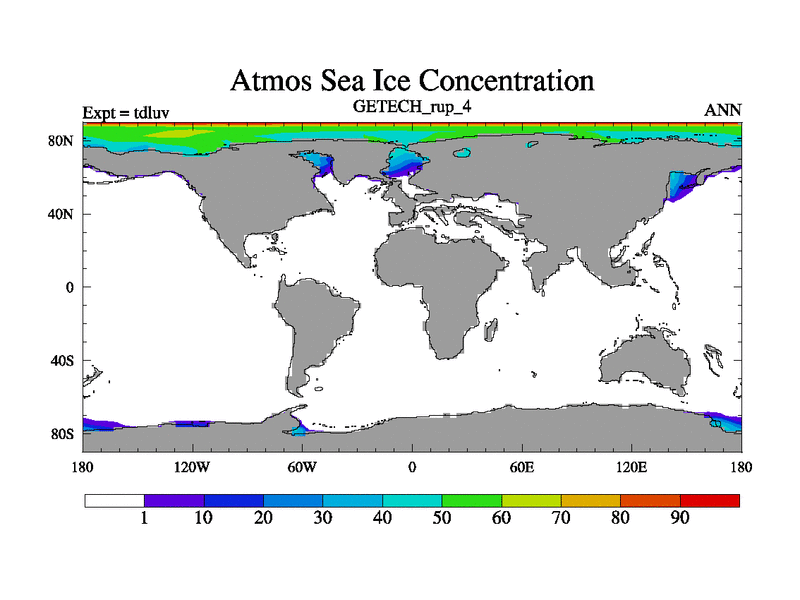
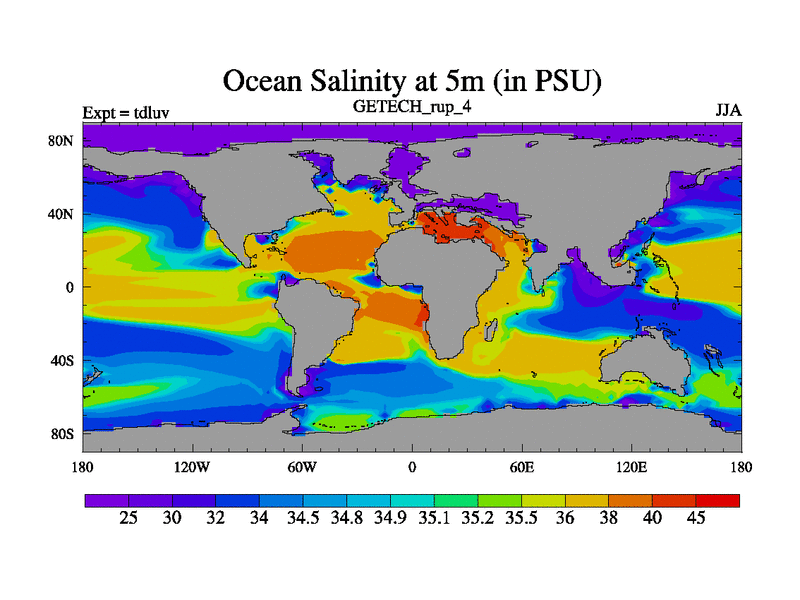
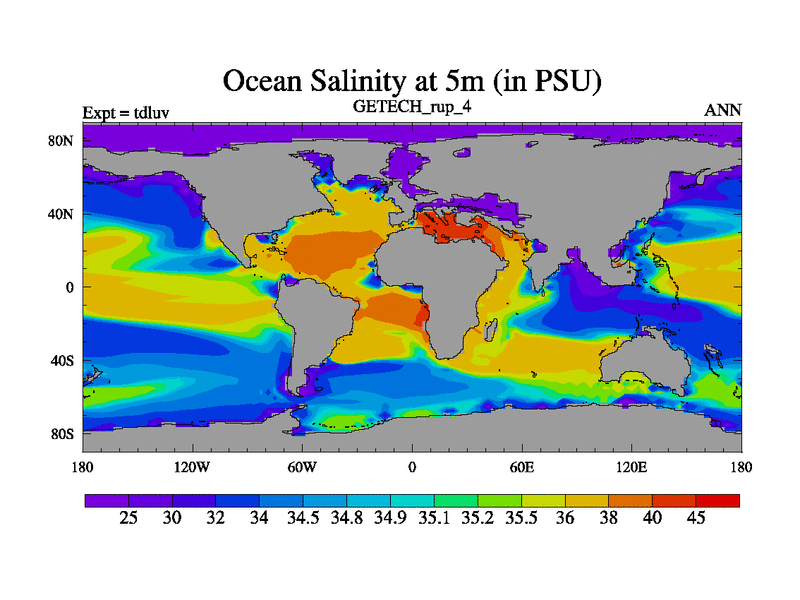
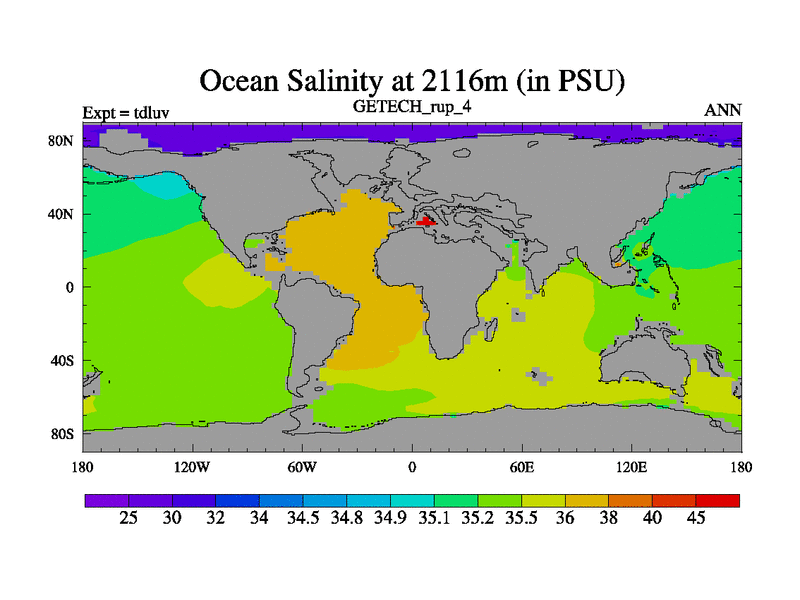
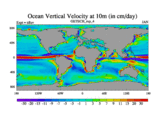
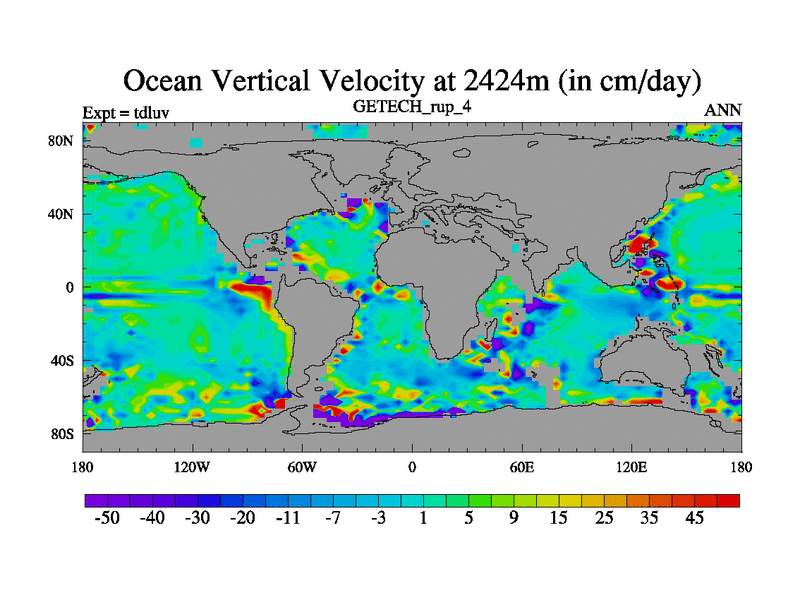
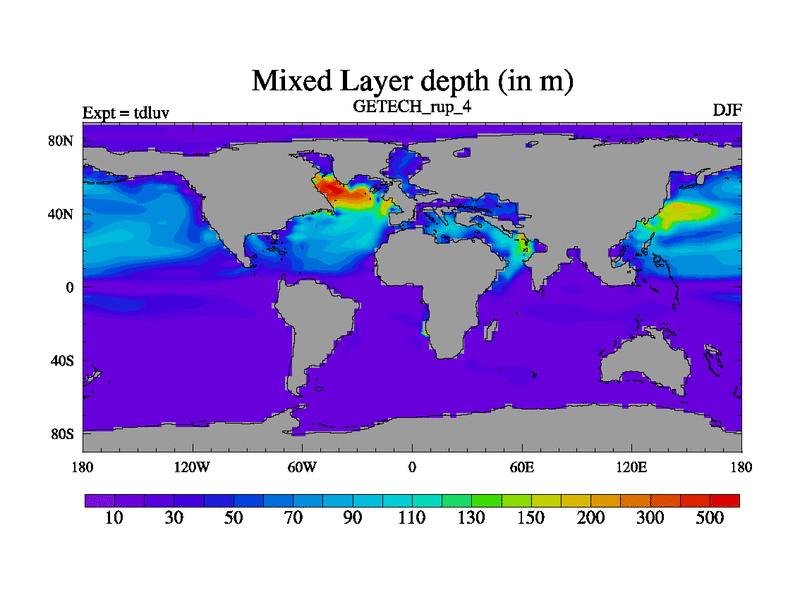
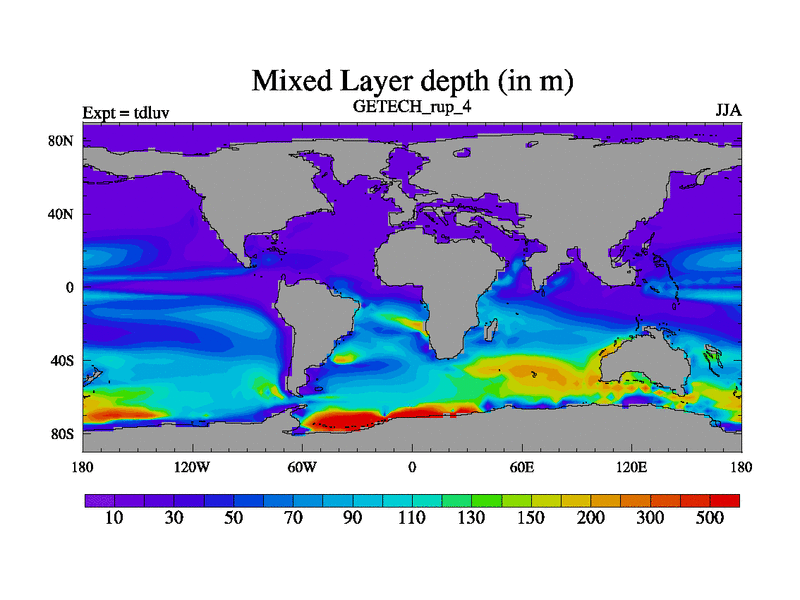
Summary of Results for Experiment tdluv
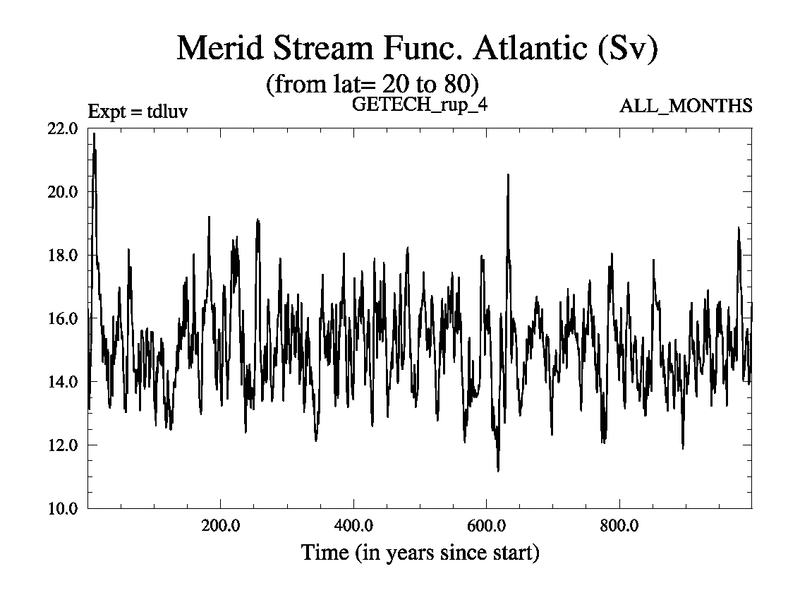
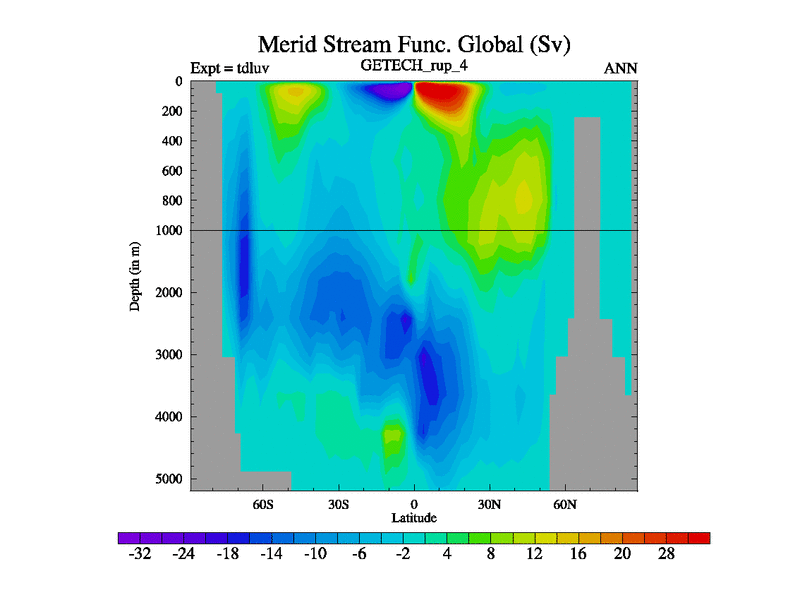
Atlantic Meridional Overturning Strength
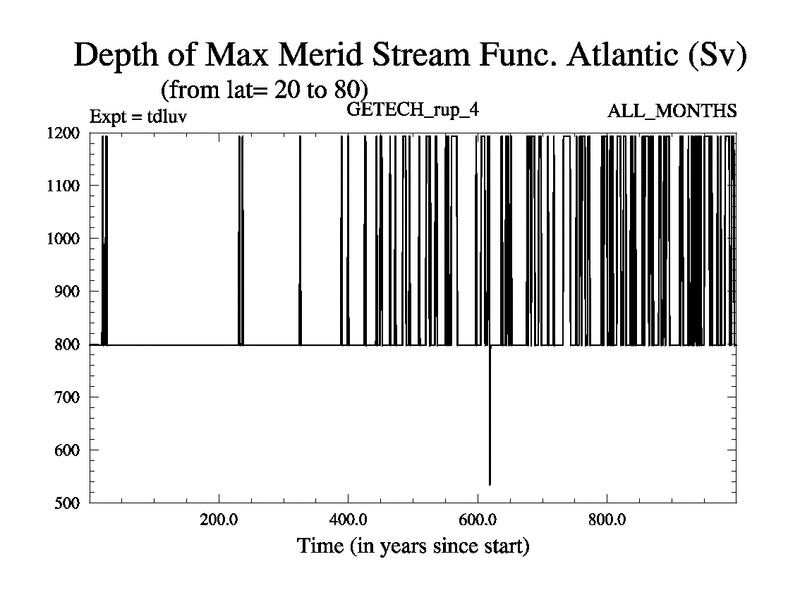
Depth of Max Atlantic Overturning
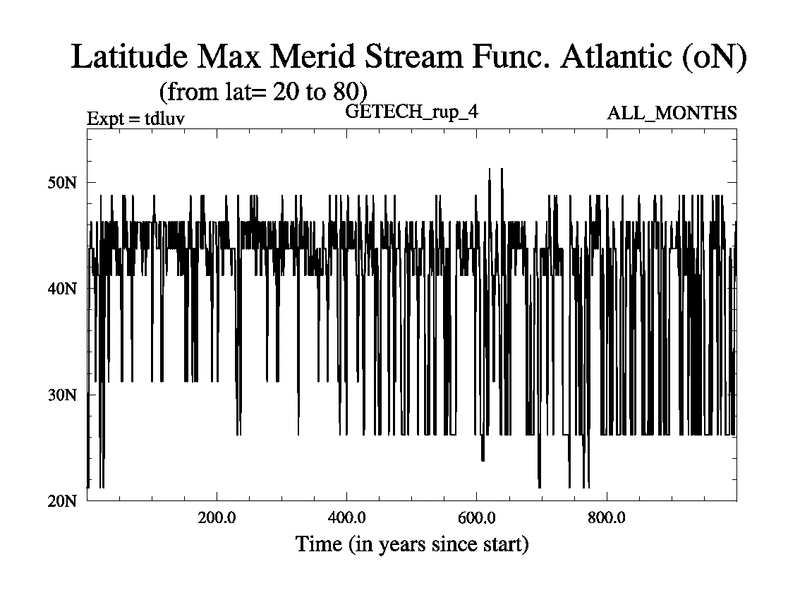
Latitude of Max Atlantic Overturning
Variable
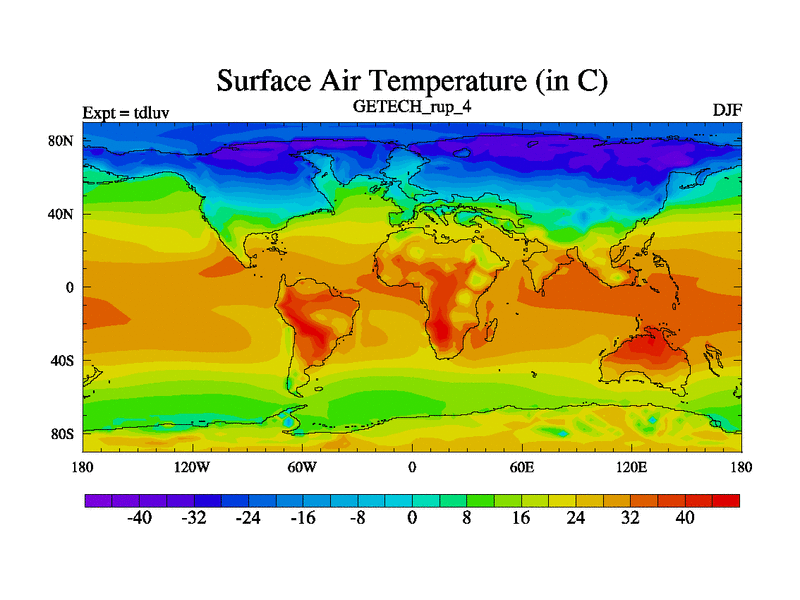
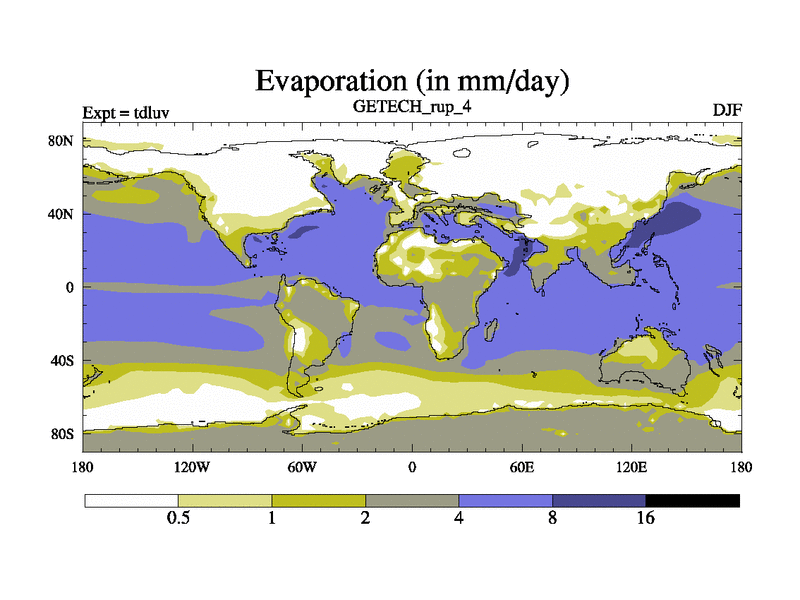
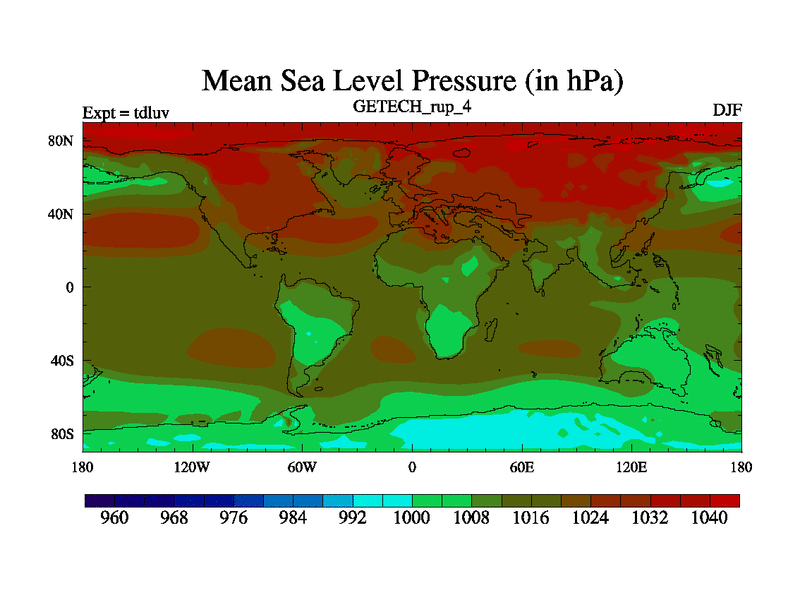
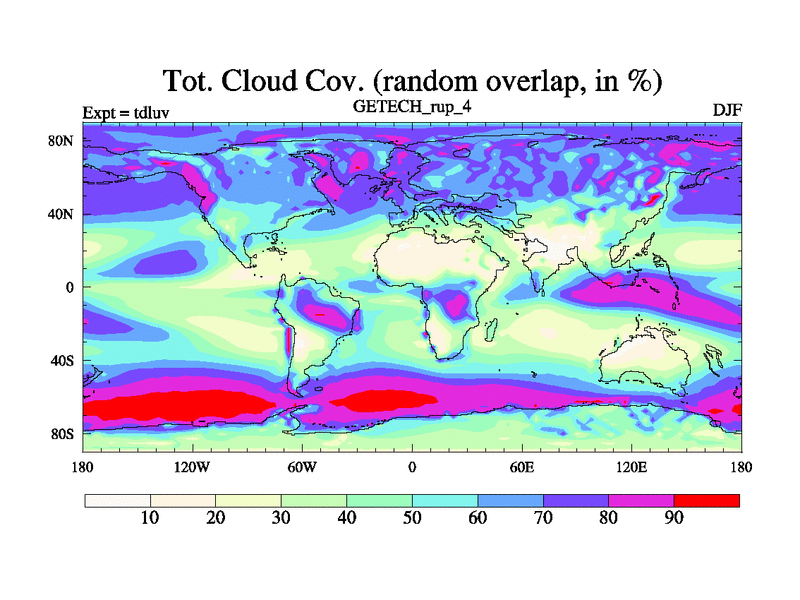
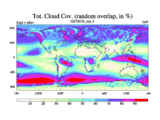
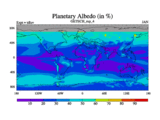
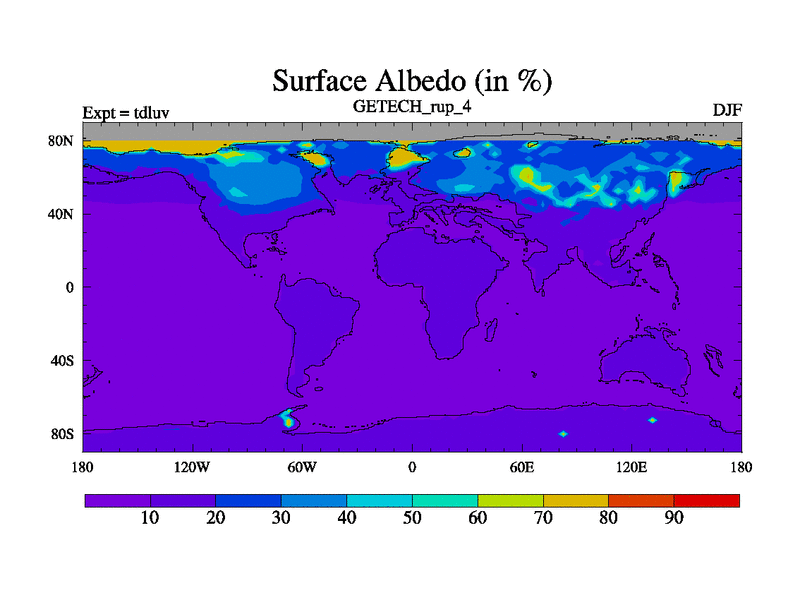
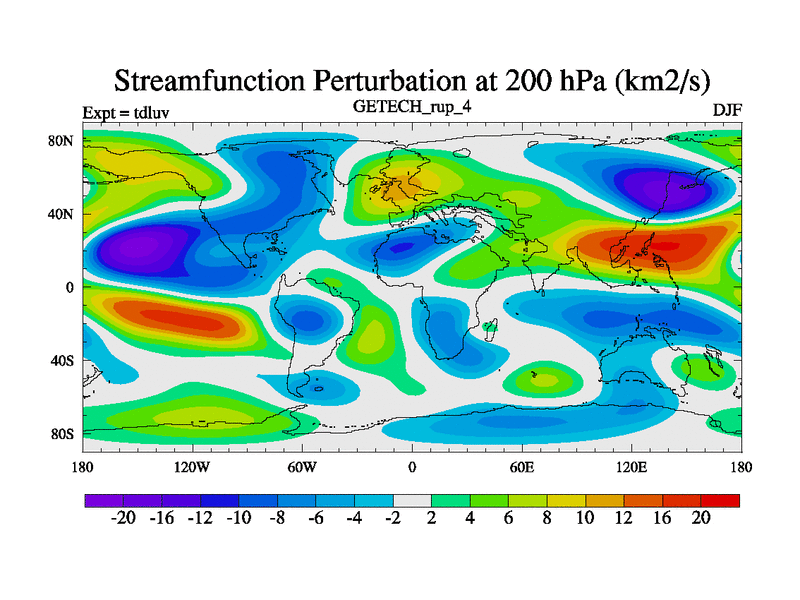
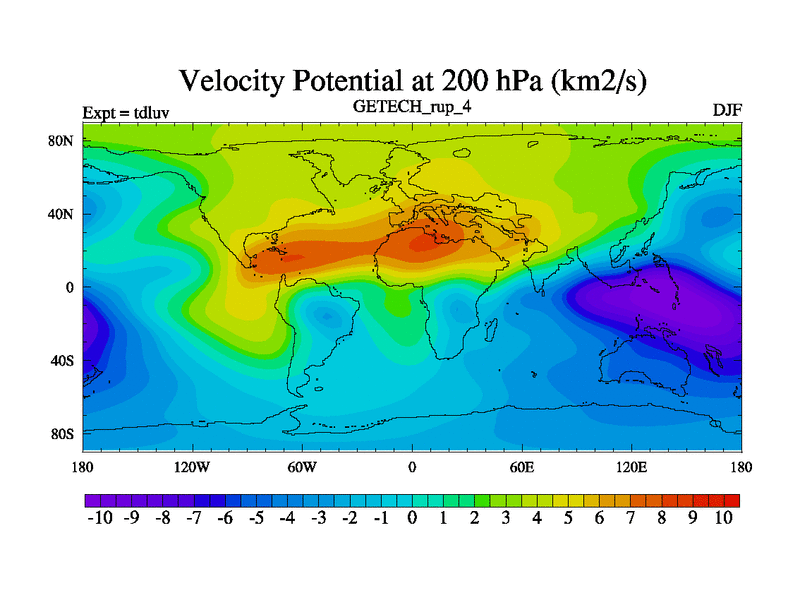
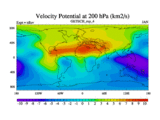
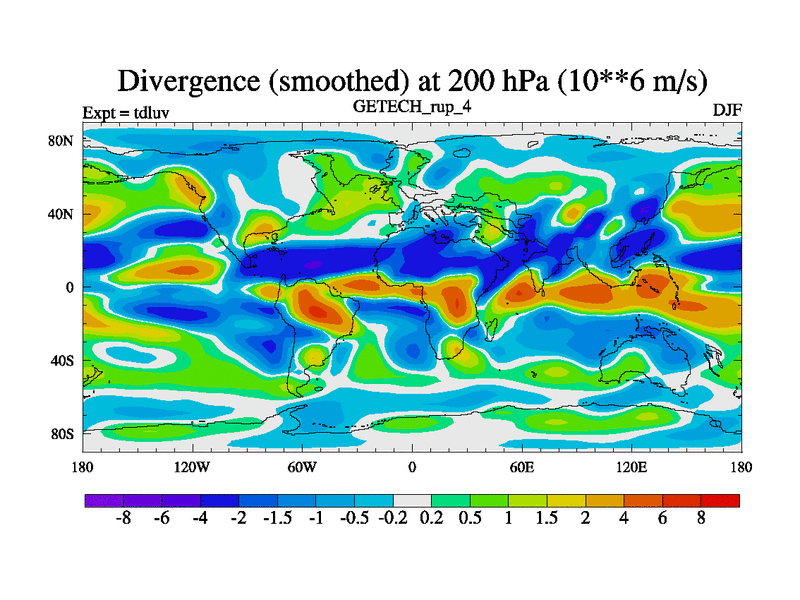
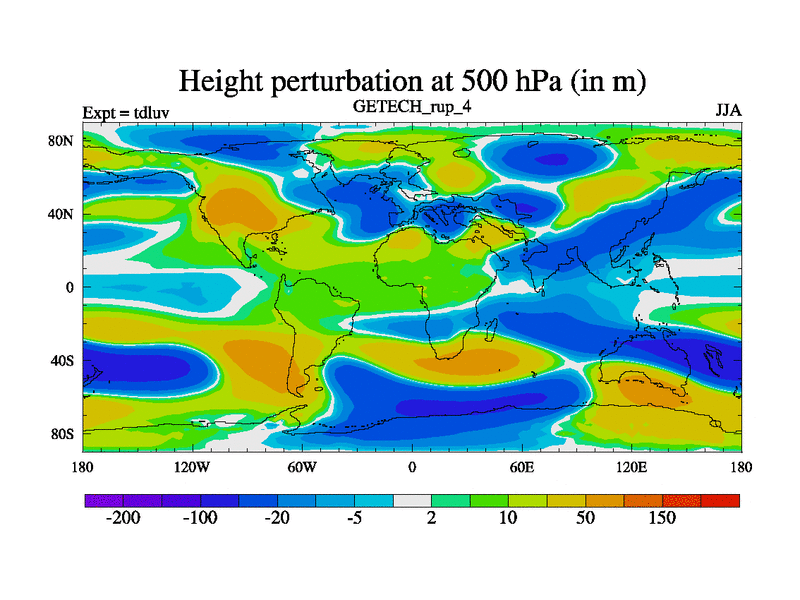
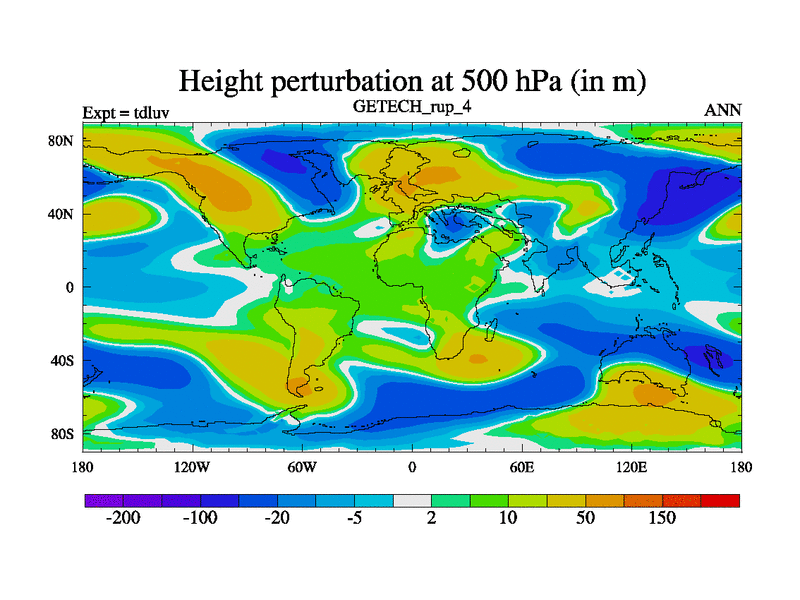
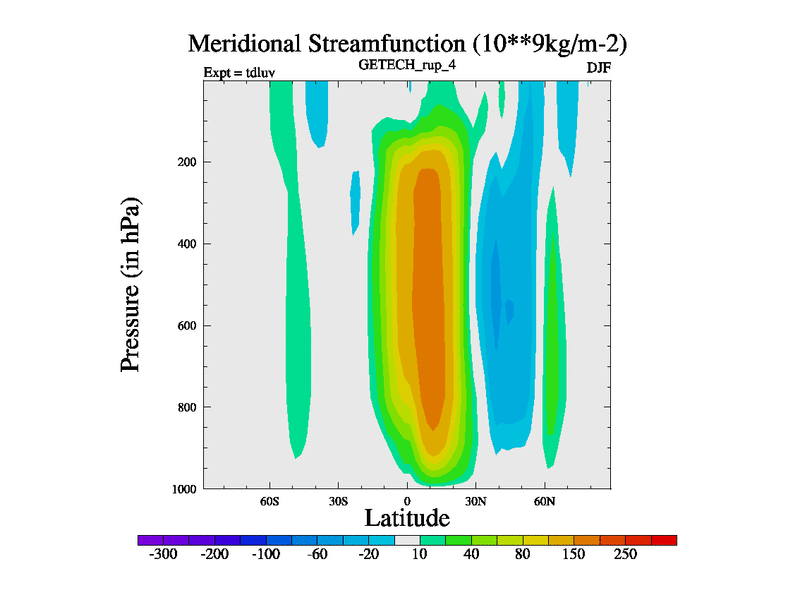
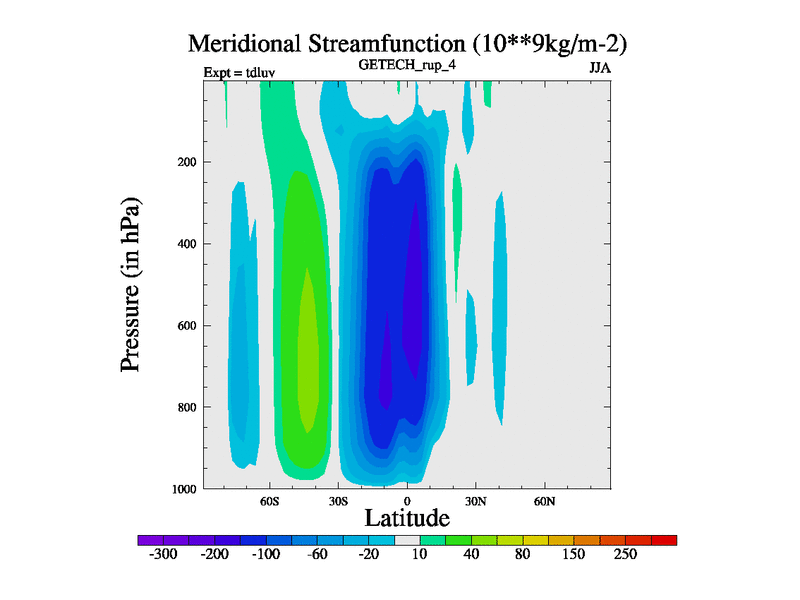
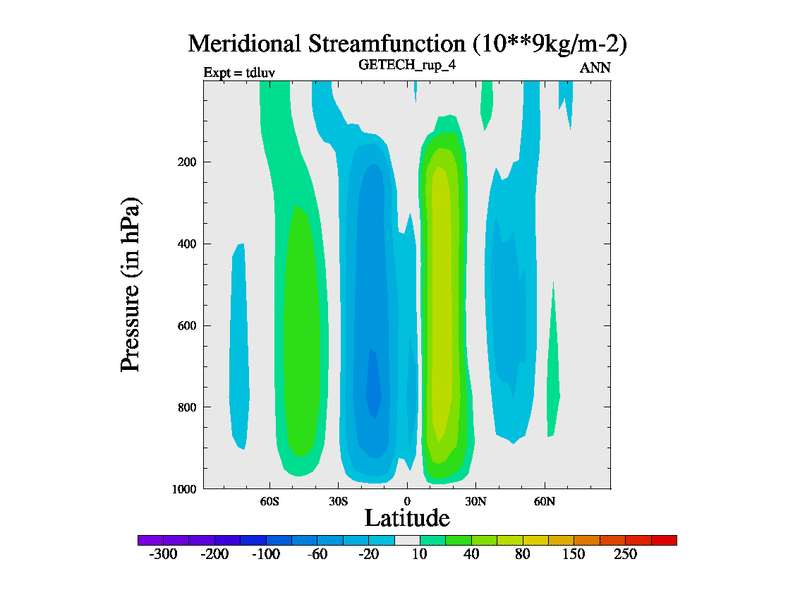
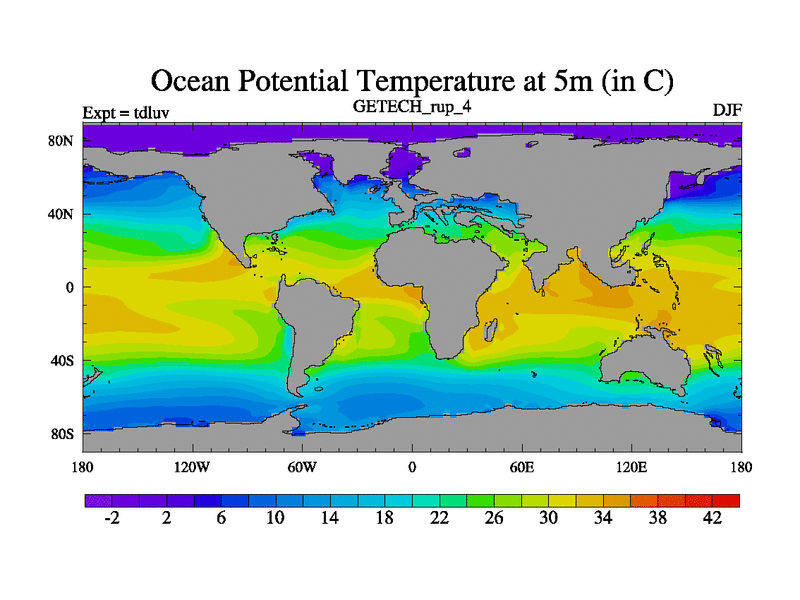
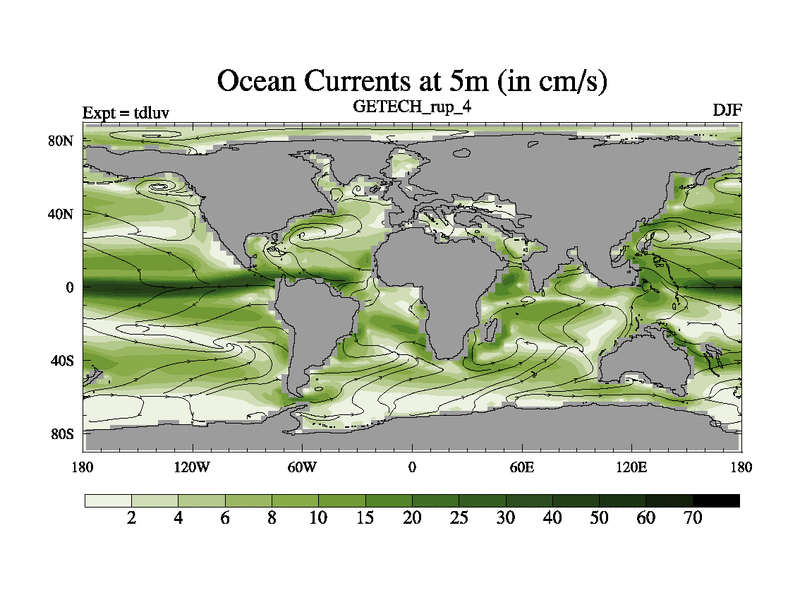
DJF
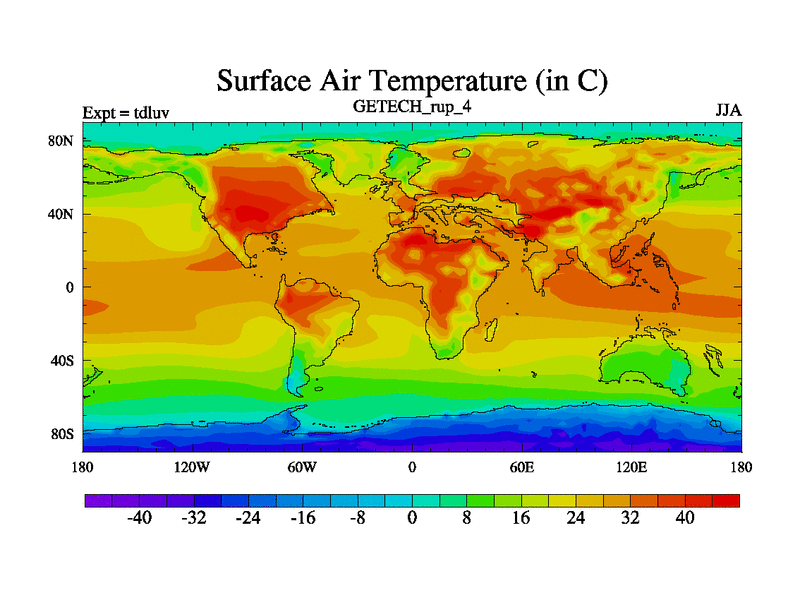
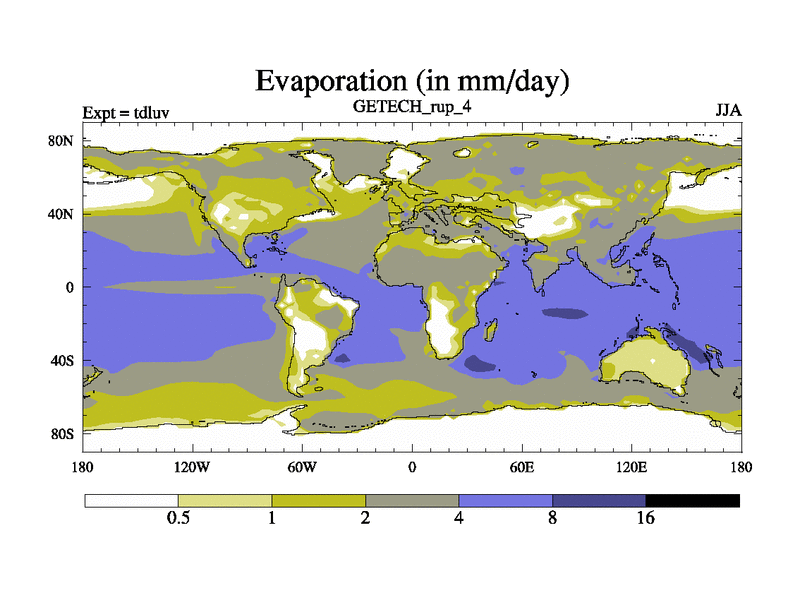
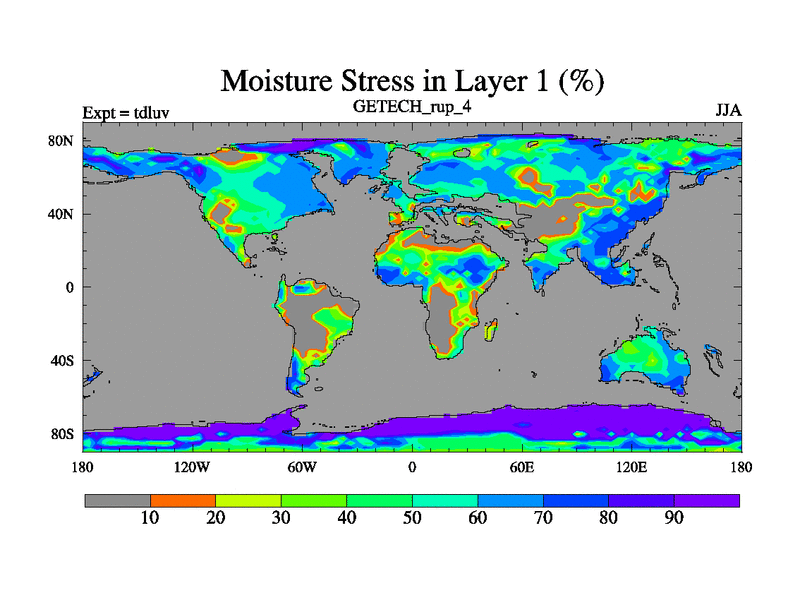
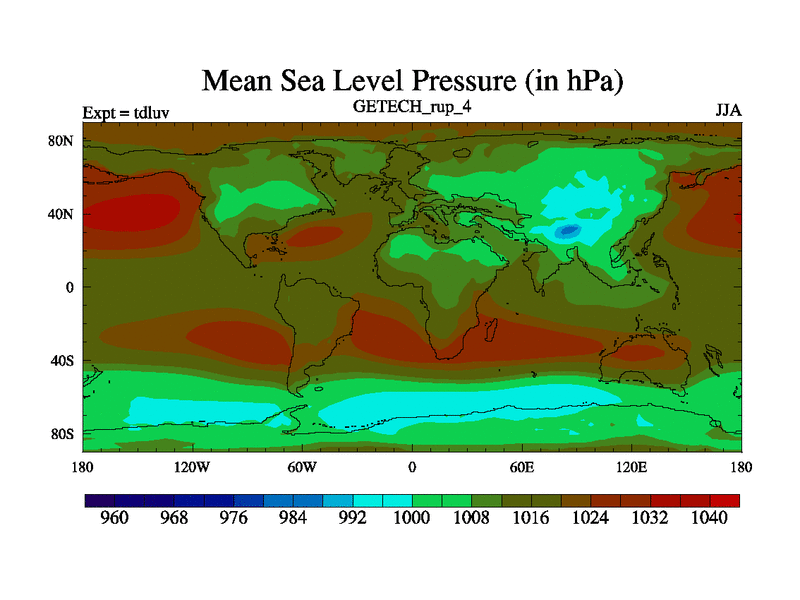
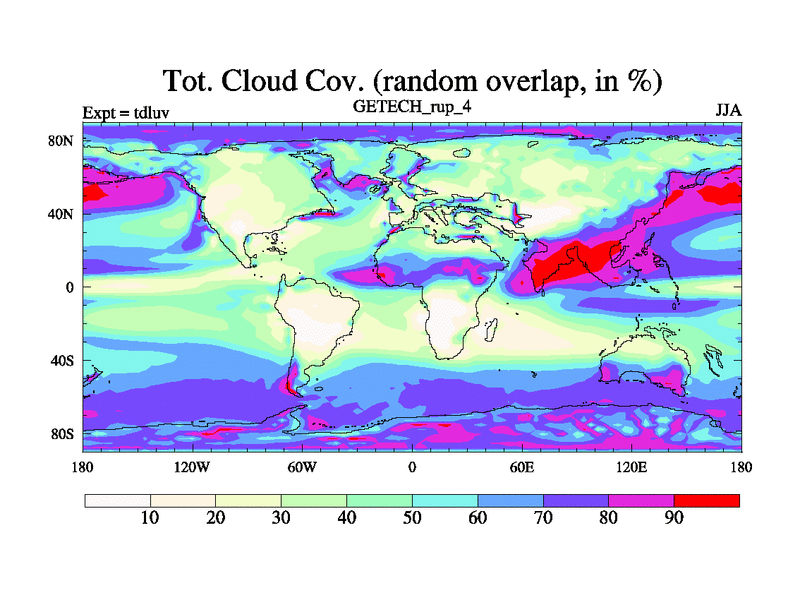
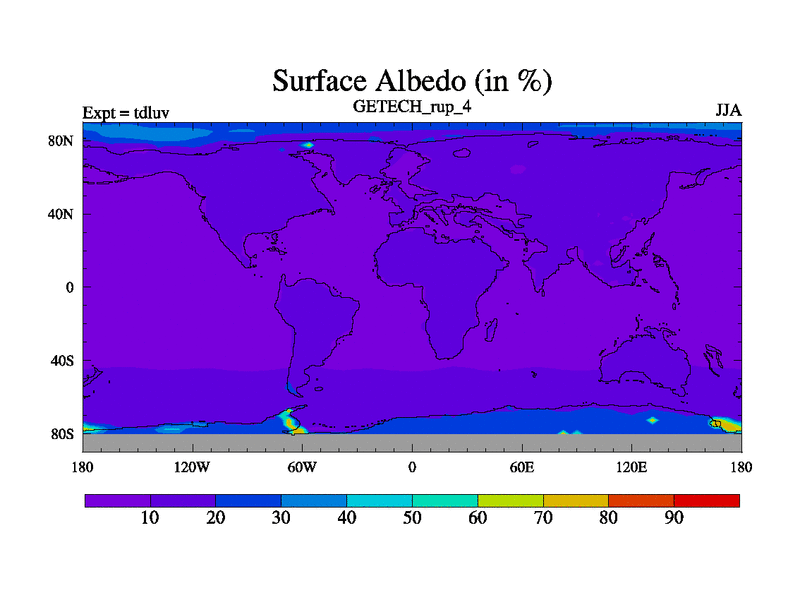
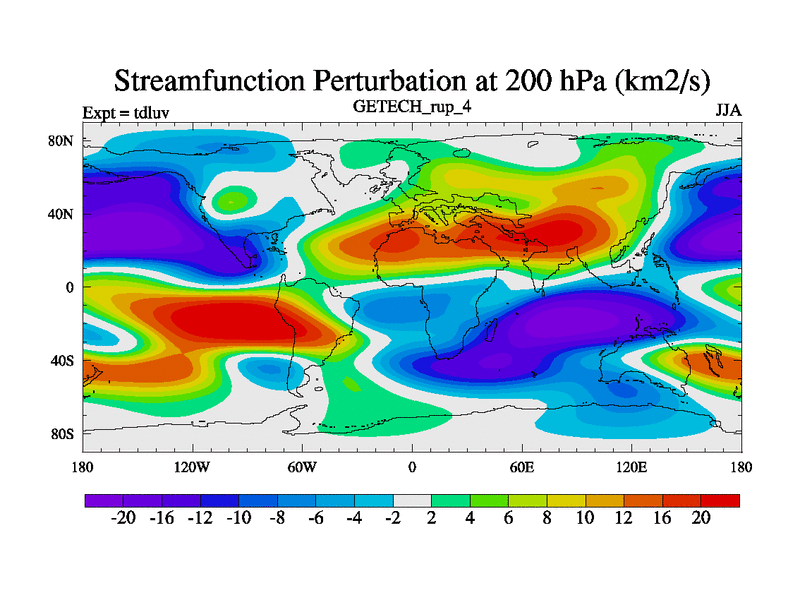
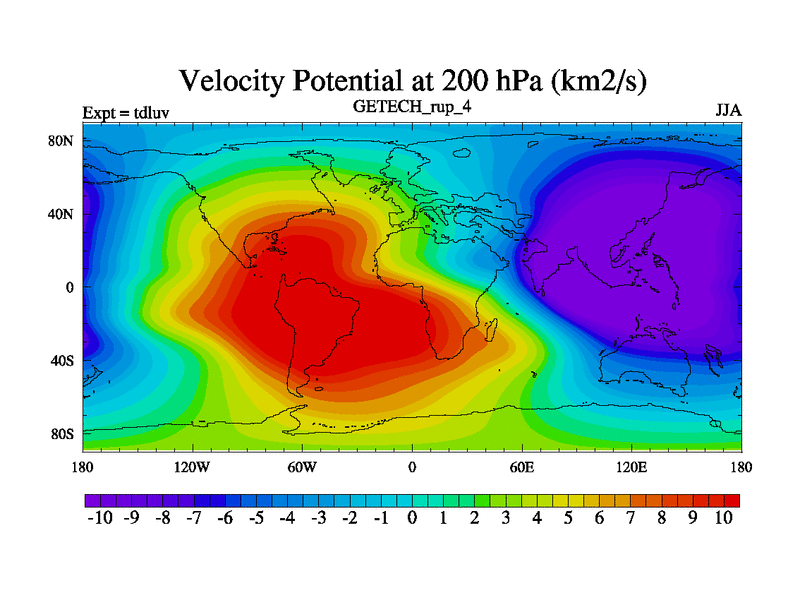
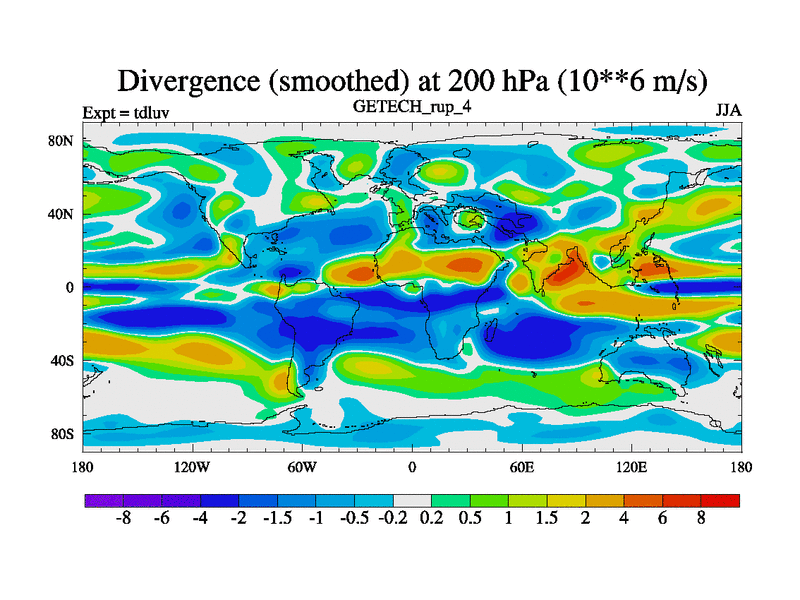
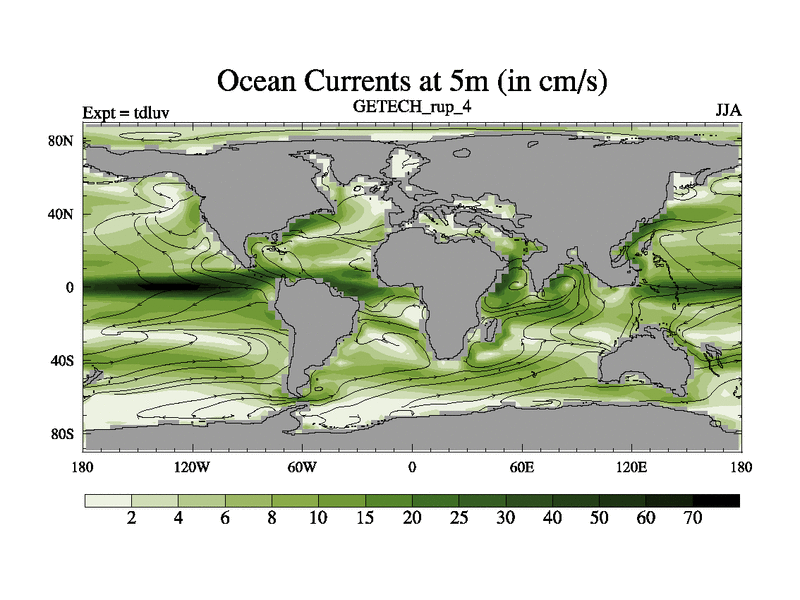
JJA
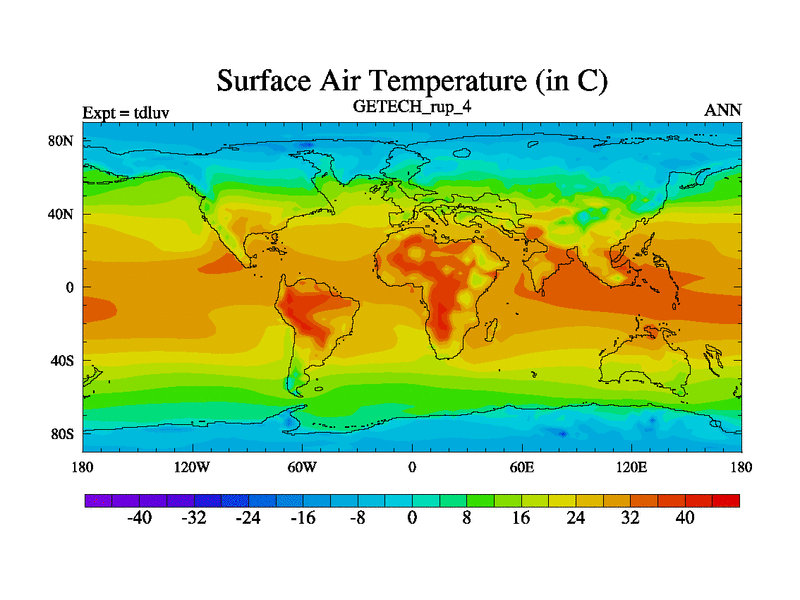
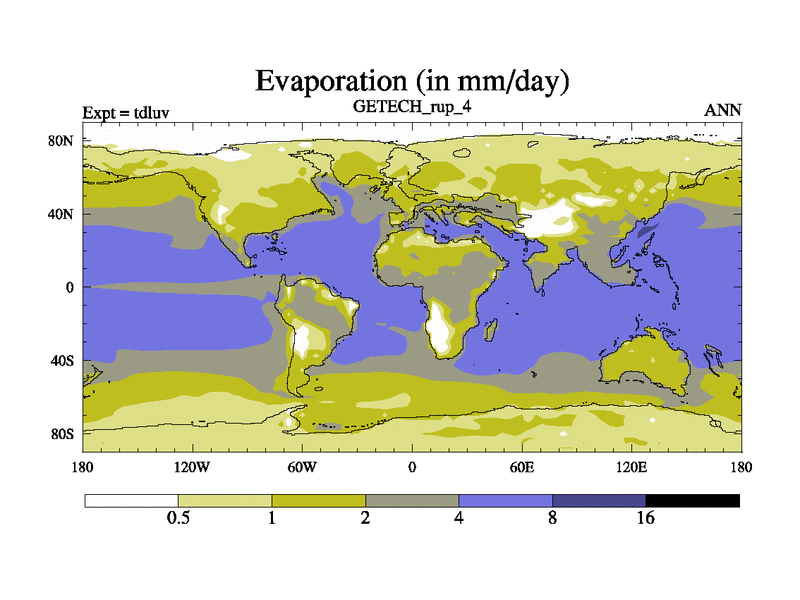
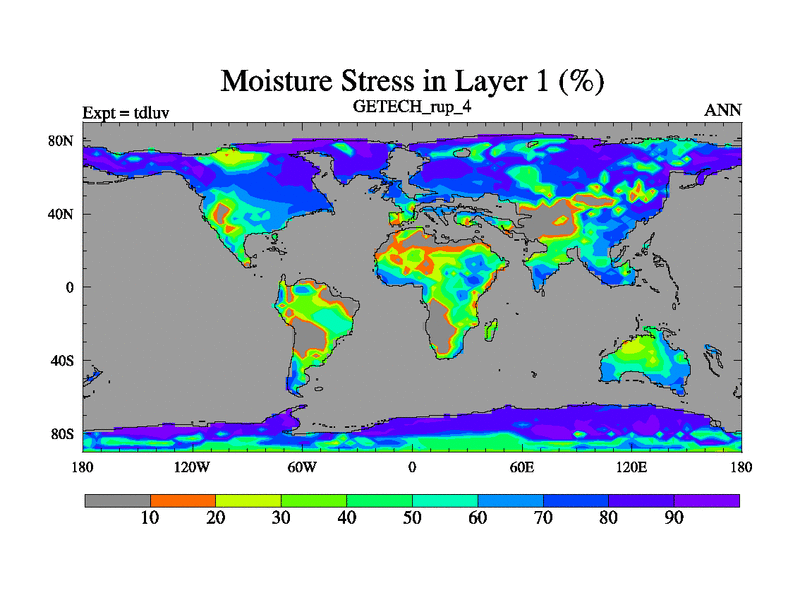
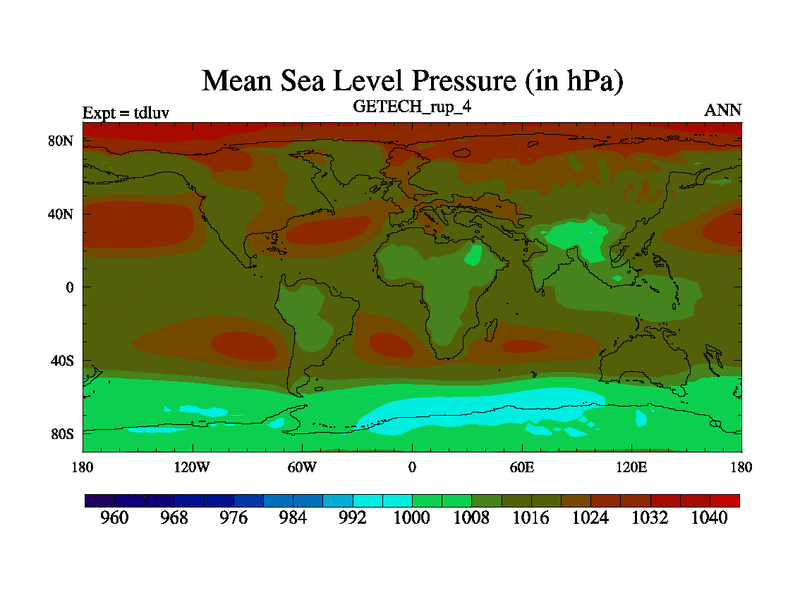
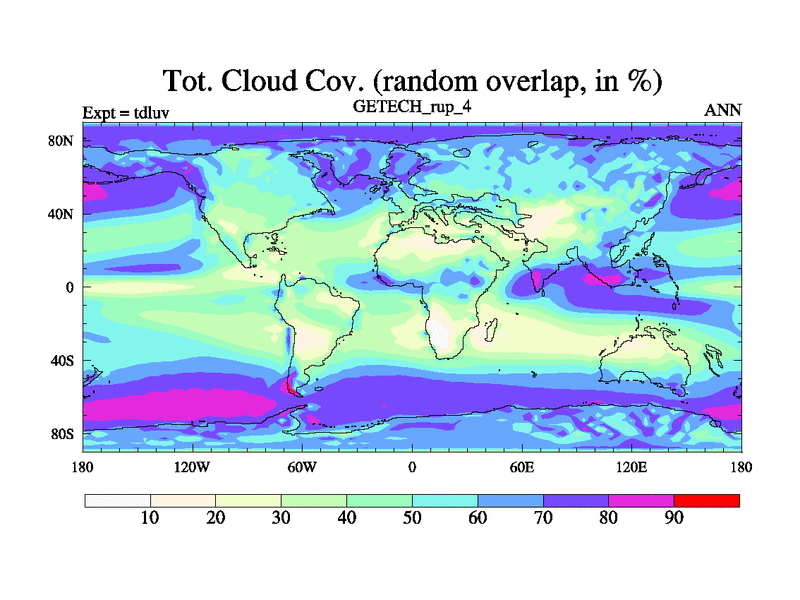
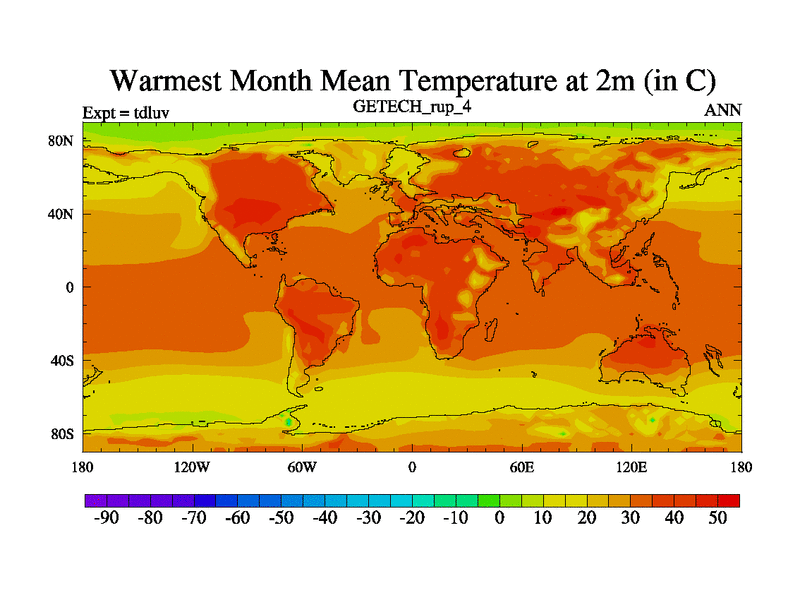
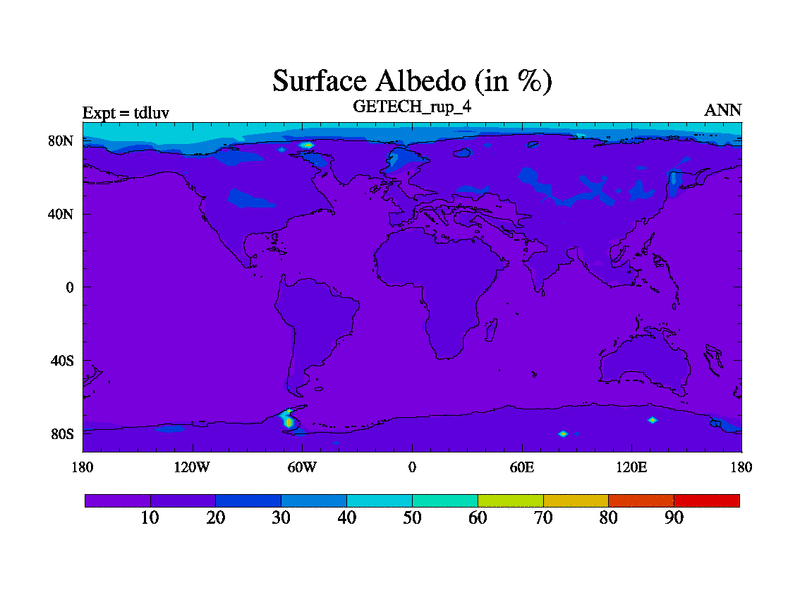
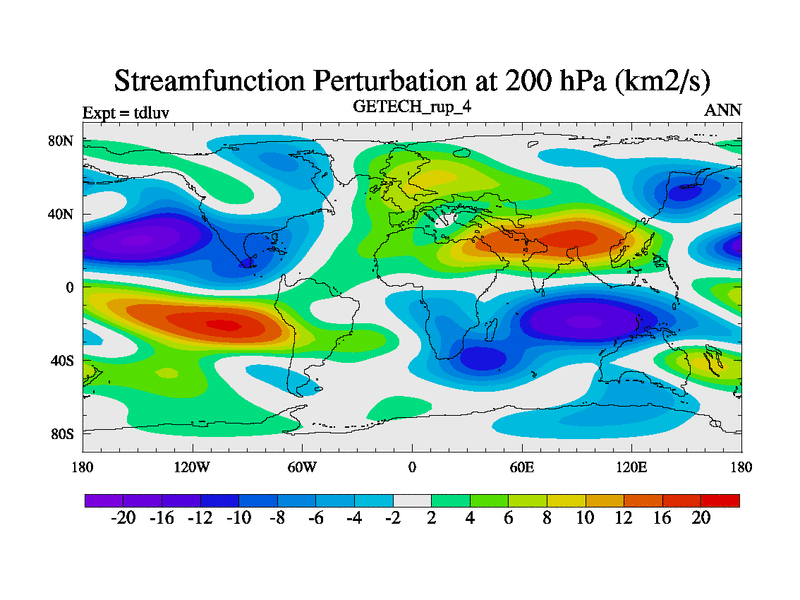
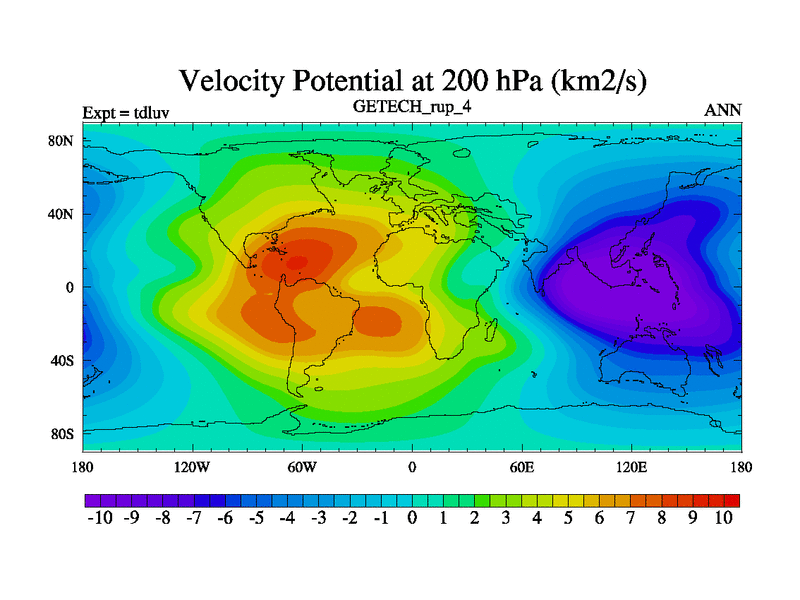
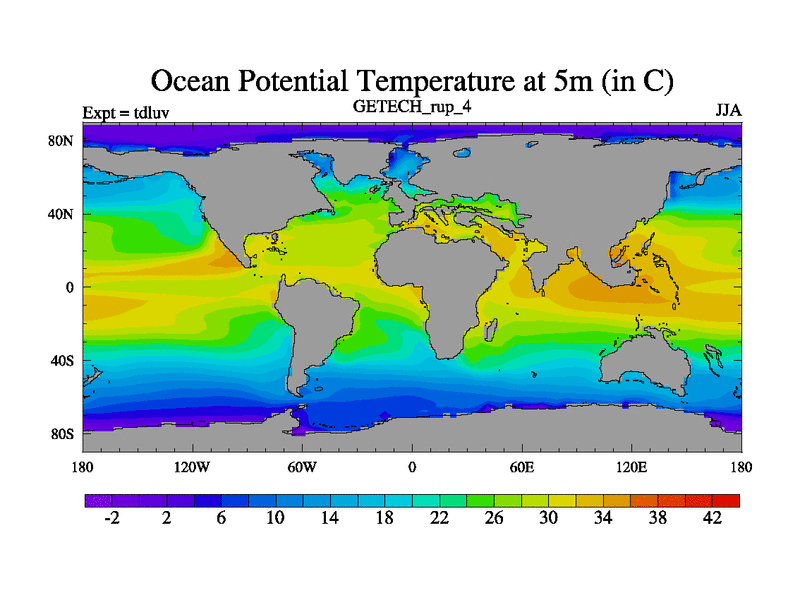
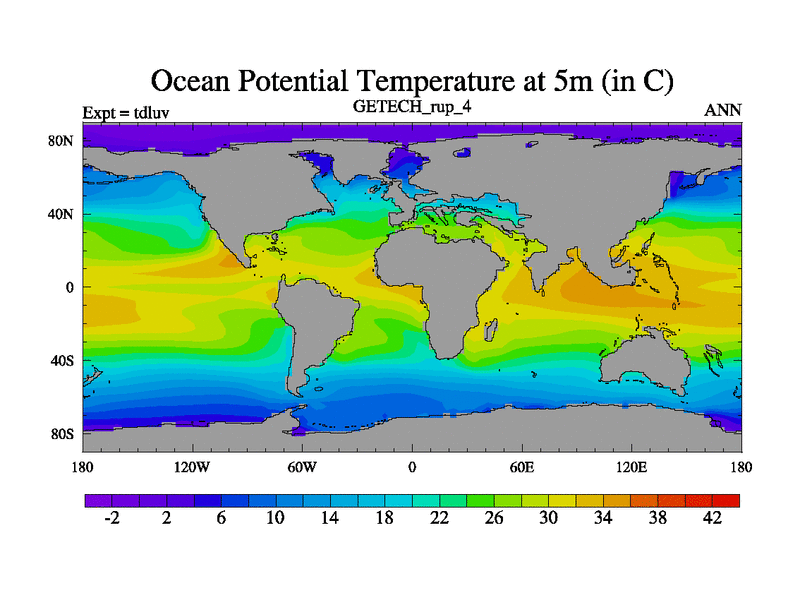
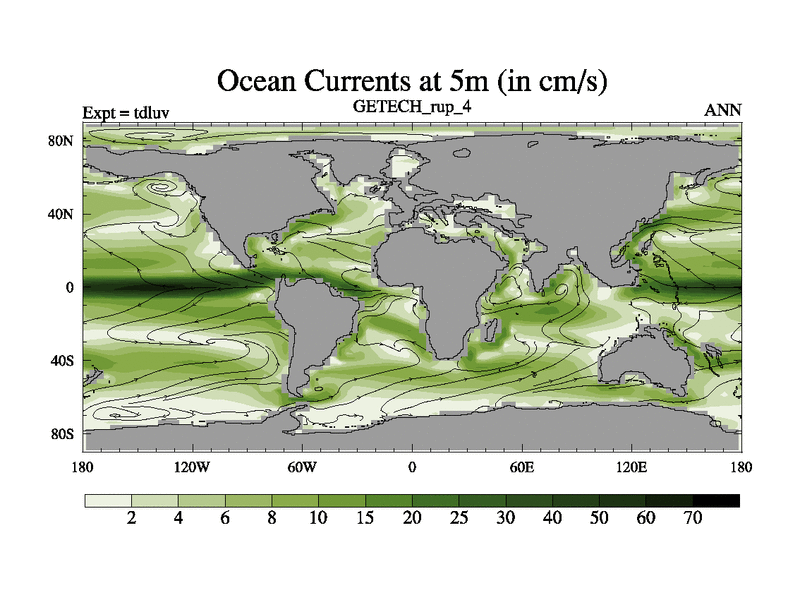
ANN
Monthly
Variable
Surface Air Temperature
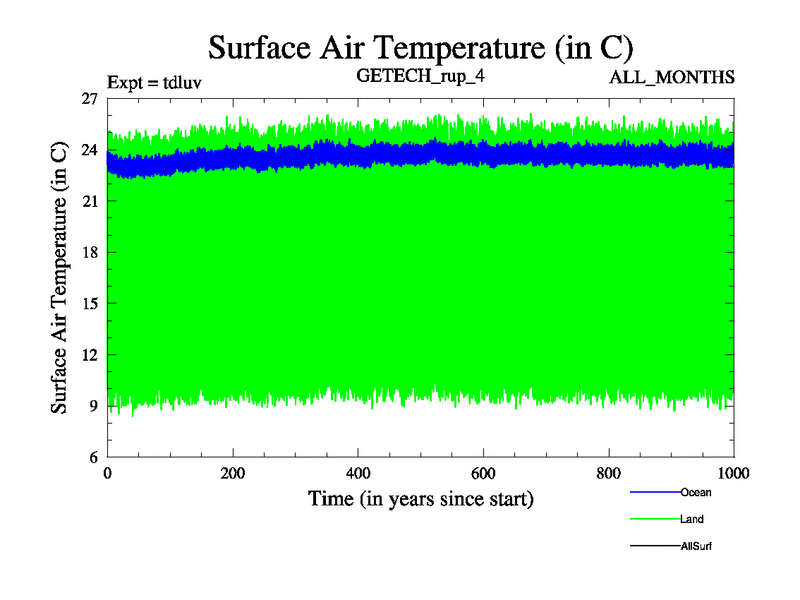
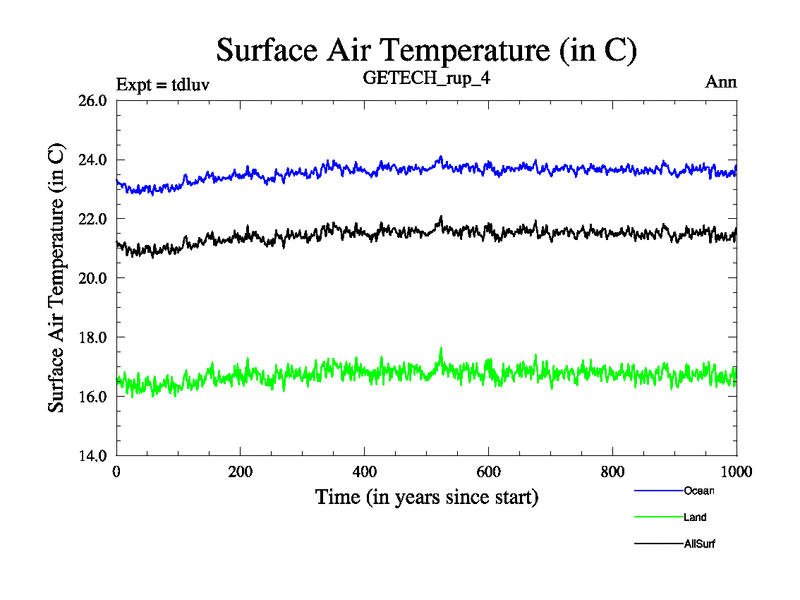
Surface Air Temperature Time Series
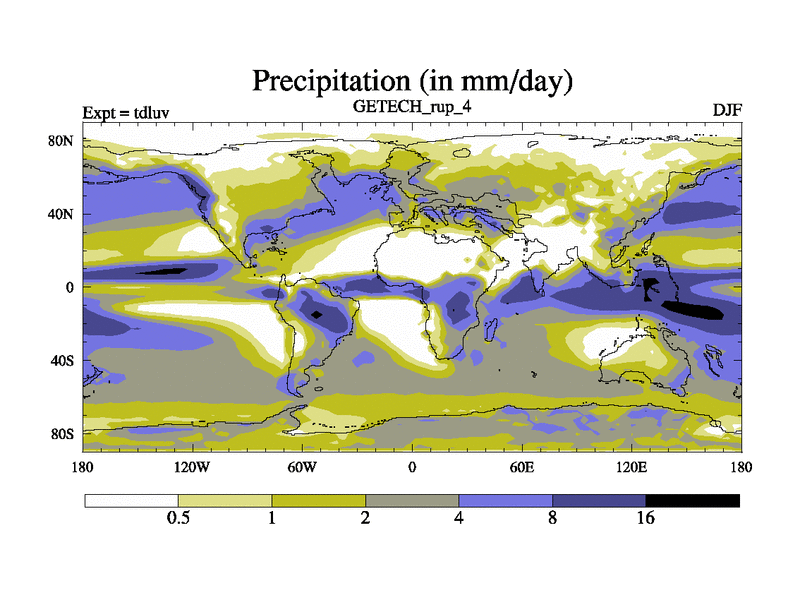
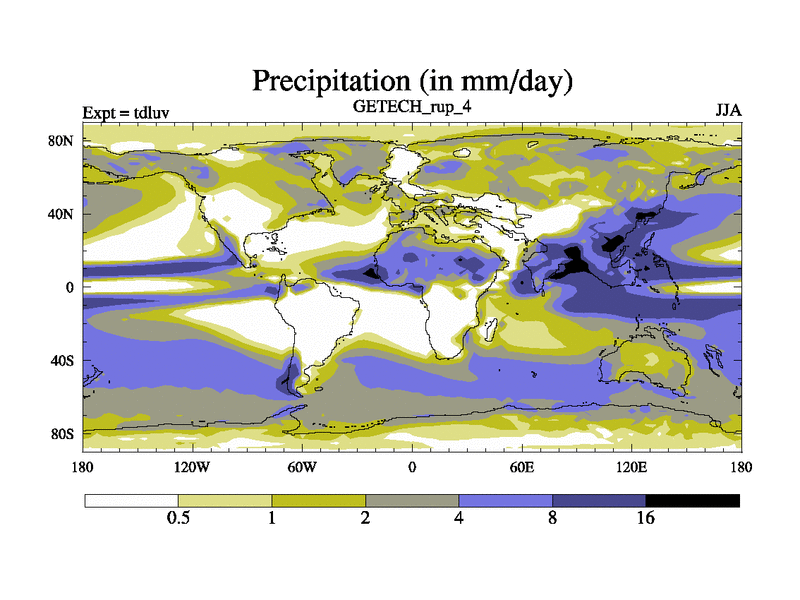
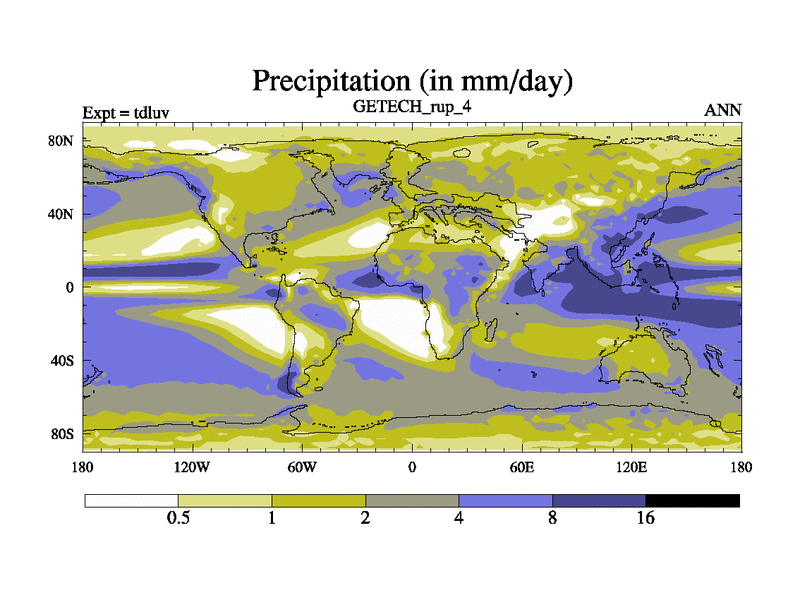
Total Precipitation
Surface Air Temperature Time Series (annual means)
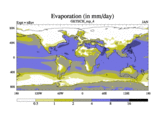
Evaporation
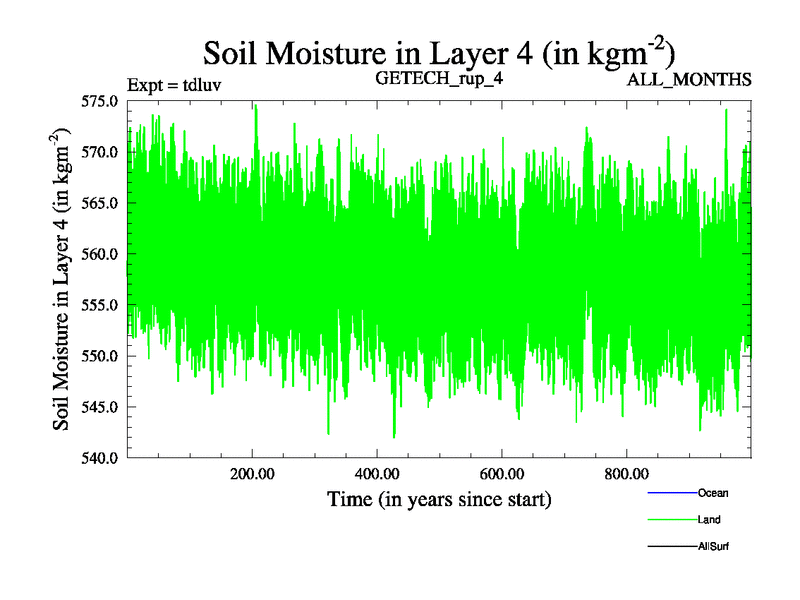
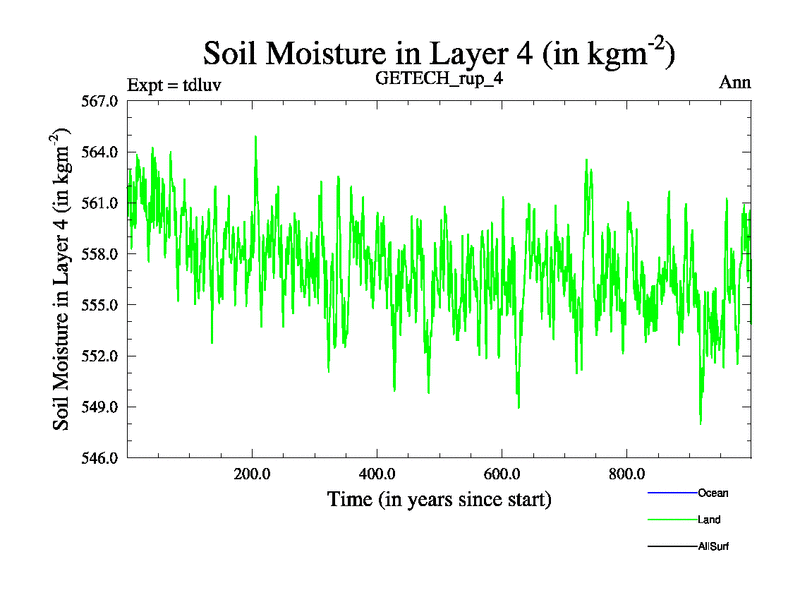
Soil Moisture in Layer 4 (Deepest layer)
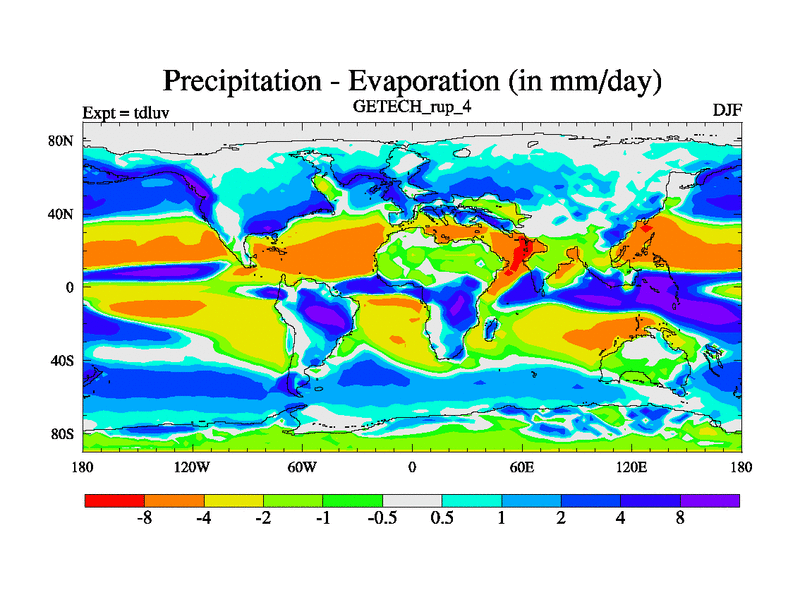
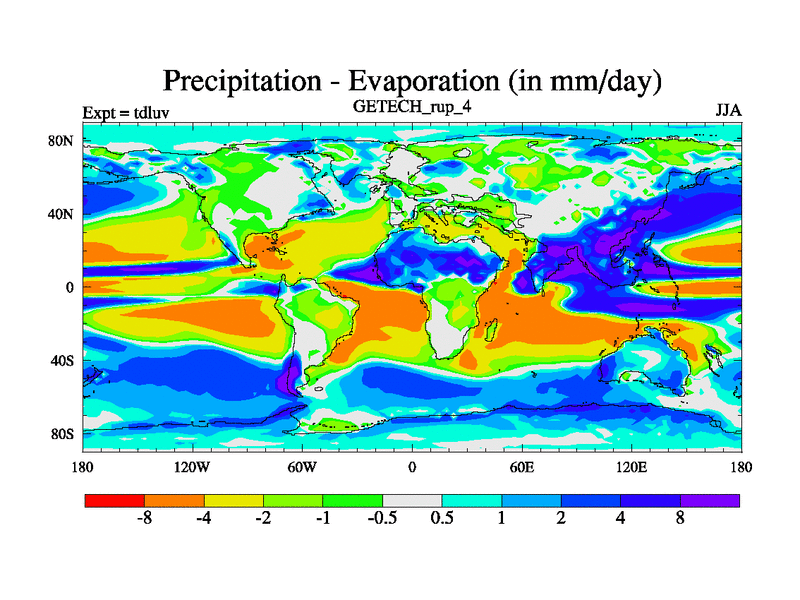
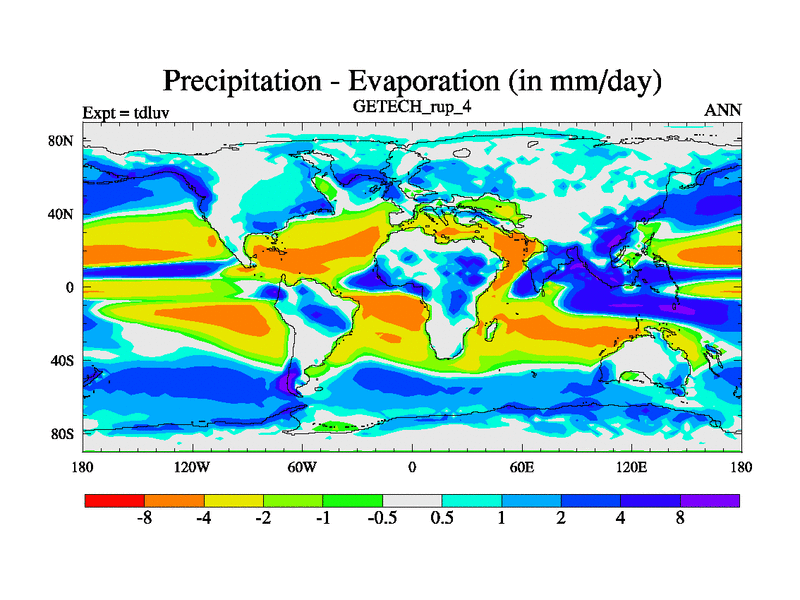
Precipitation - Evaporation
Soil Moisture in Layer 4 (Deepest layer) (annual means)