Bristol Research Initiative for the Dynamic Global
Environment
with the
University of Reading, Open University, and the British Antarctic Survey.
Model Simulations
Experiment: tctre
A long description of this run is currently not available
Brief Description
Fuller Description
Total Length of Run (in years)
Averaging period (in years)
Spinup period (in years)
CO2 (in ppmv)
CH4 (in ppbv)
N2O (in ppbv)
CFC11 (in pptv)
CFC12 (in pptv)
Computer used for simulation
Compiler used for simulation
Date of first entry in datebase
Date of most recent modification to entry in database
21kyr_orbit_RAGS_ice_improved
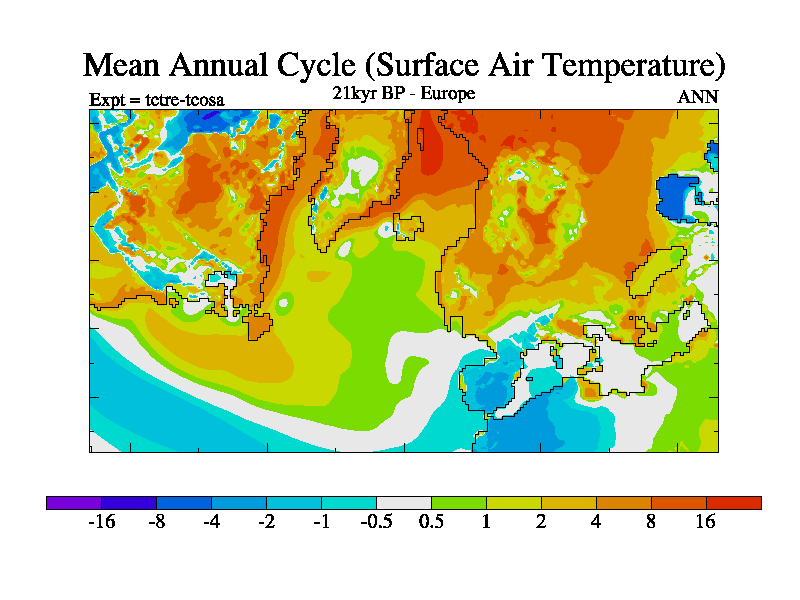
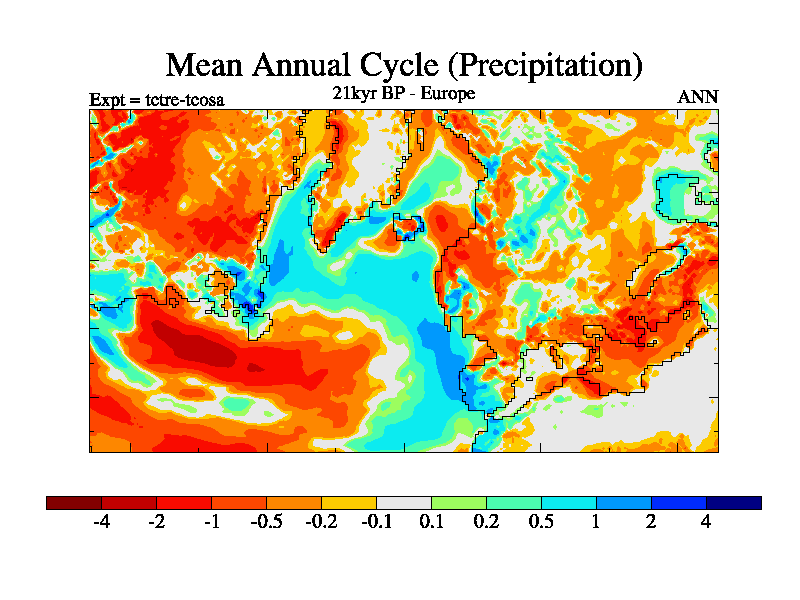
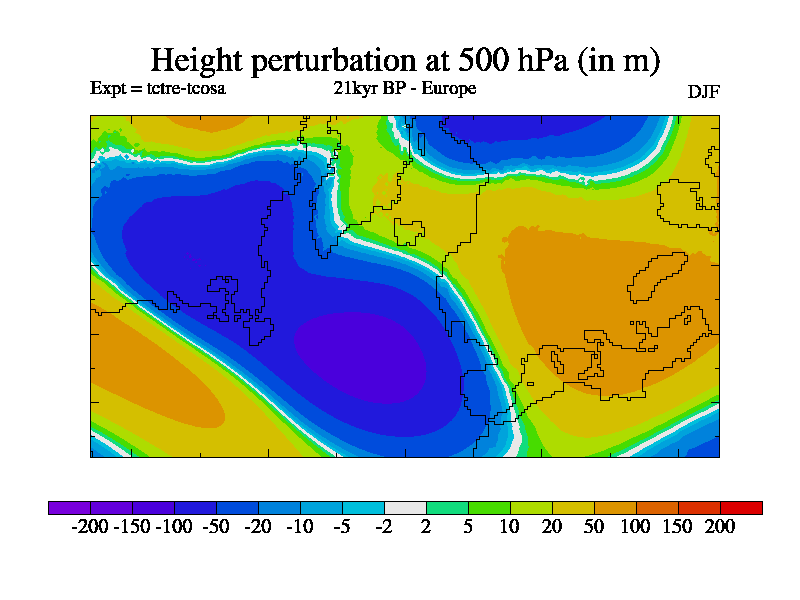
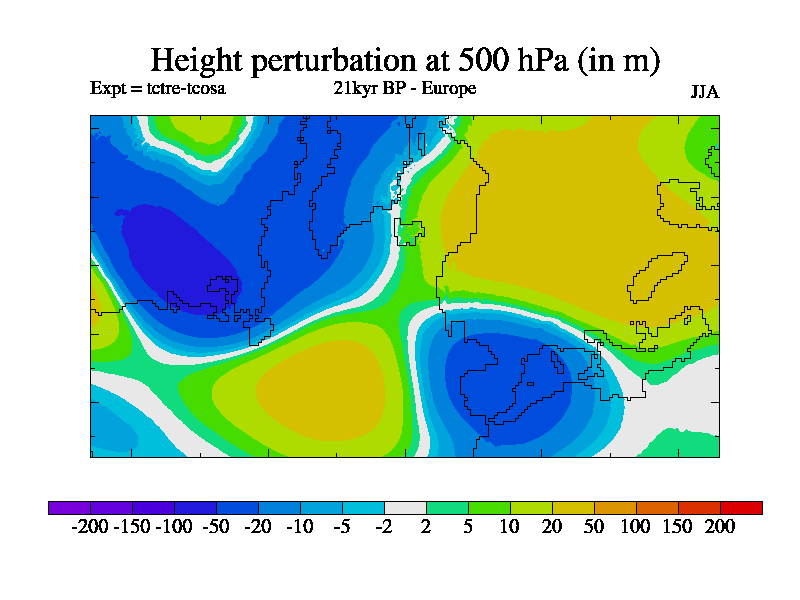
This simulation is identical to tctqe but for the European LAM. It uses a revised and improved method for calculating the ice sheet from Peltier. It is an 21kyr simulation for the set of BBC simulations. As control except the orbit and RAGS are for 21kyr BP, and land ice (and land sea mask is changed).
40
30
10
186
365
245
0
0
bigblue
Intel_v10.1
2009_10_17_16_33
2010_01_17_21_31
You can access the means from this run, by going here
This page shows a small subset of images from this simulation. They have
already been produced and there are no optional choices. If you want to do a
more detailed examination of the model results, you can go to the
main page and select one of the Parts. This will give you full access the system
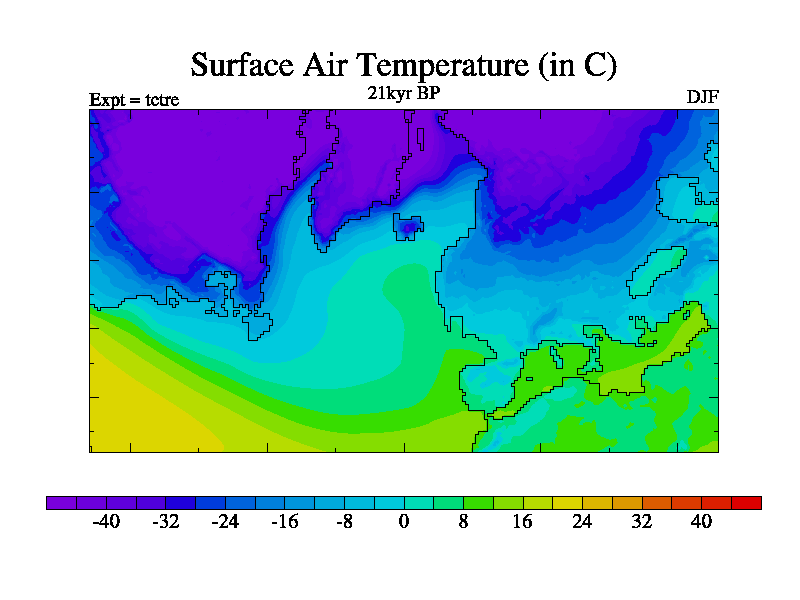
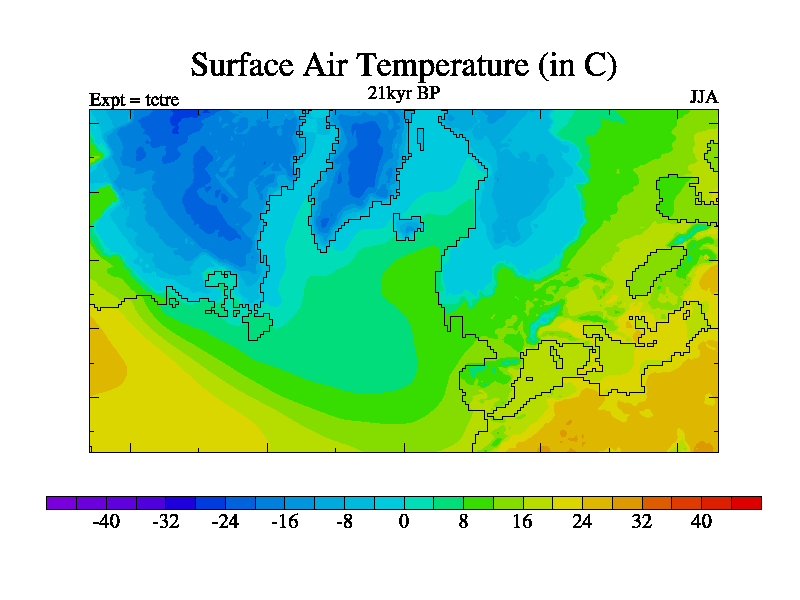
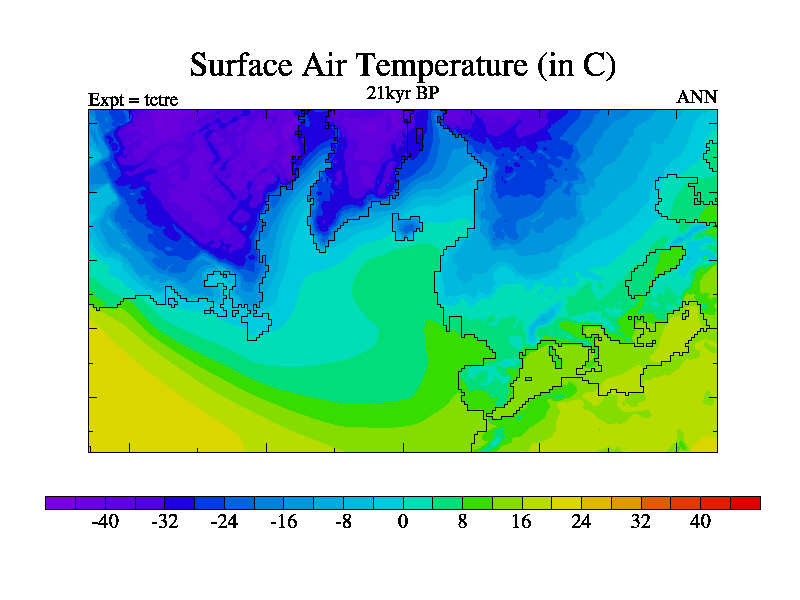
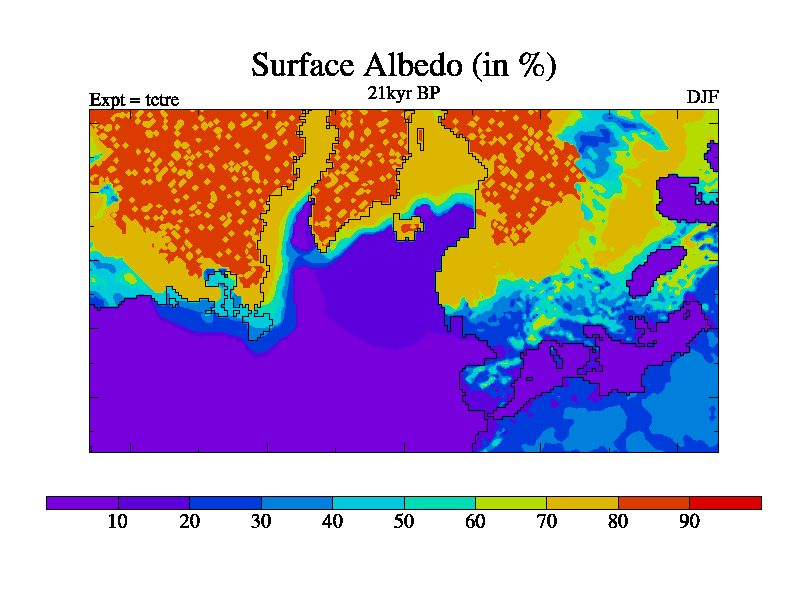
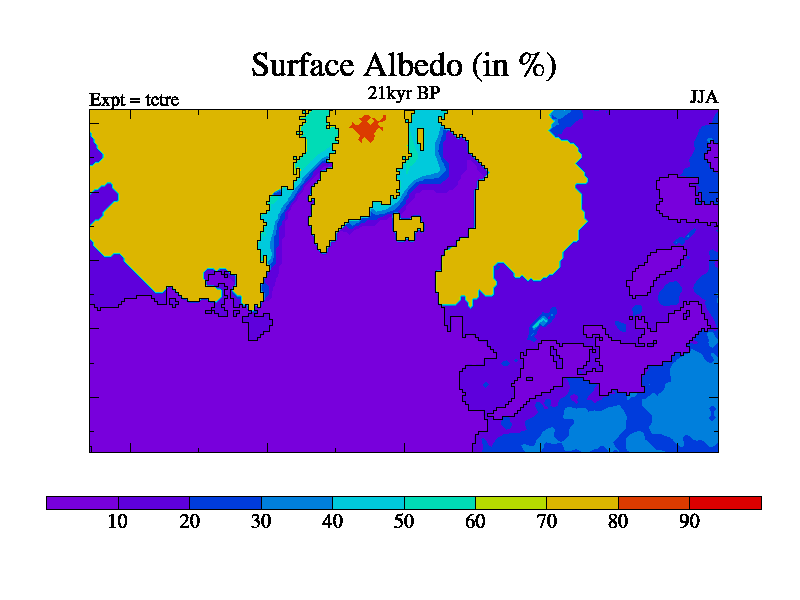
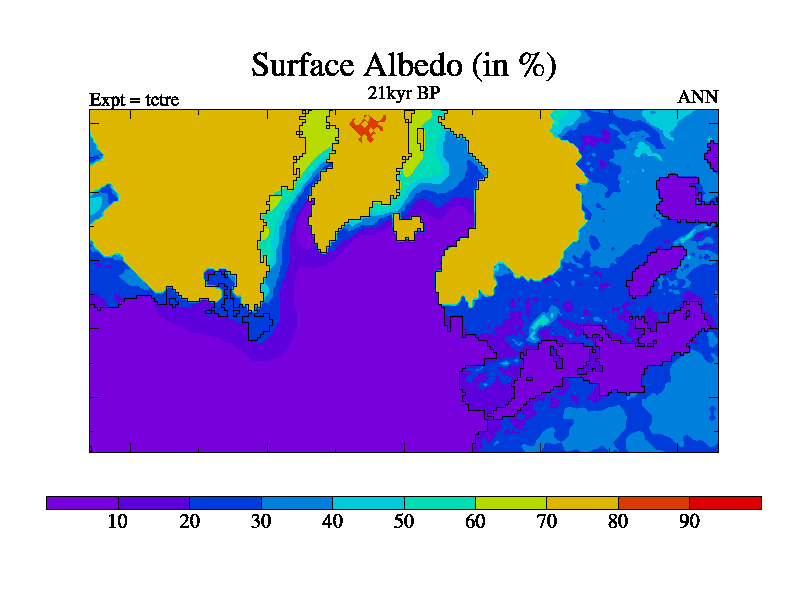
Summary of Results for Experiment tctre
Variable
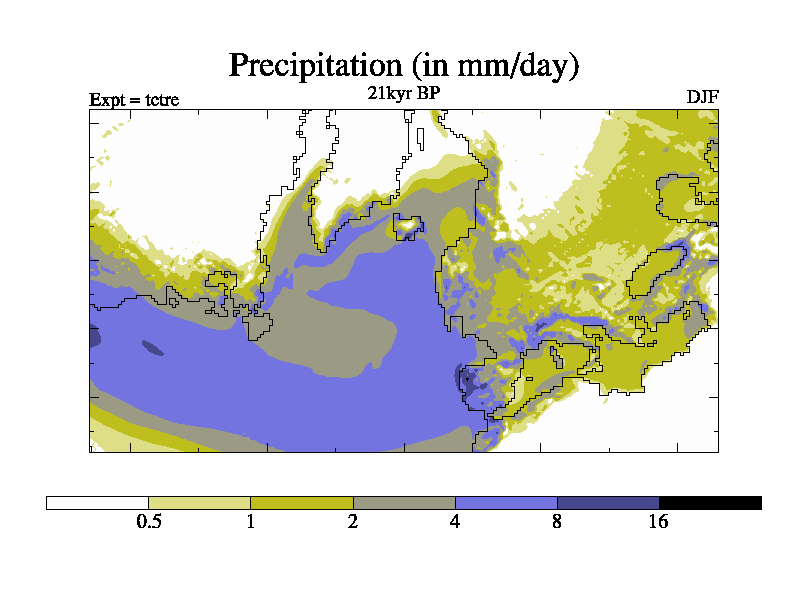
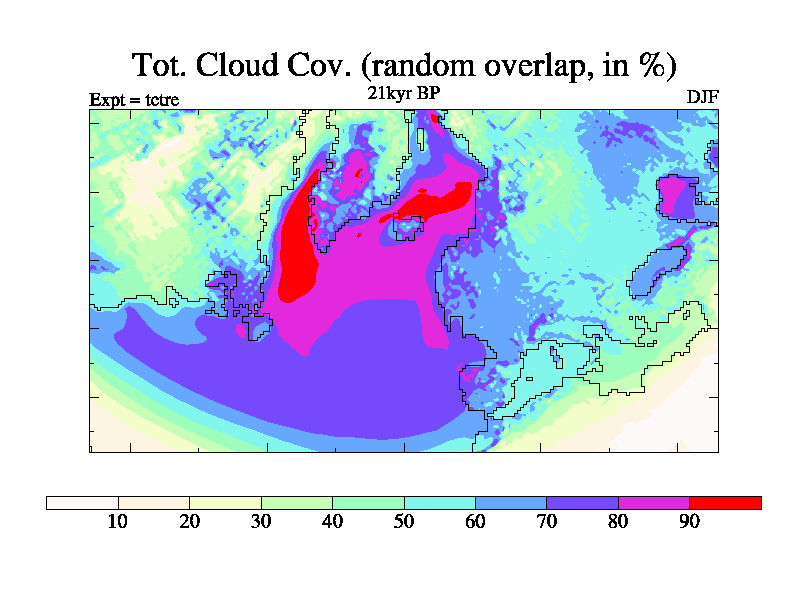
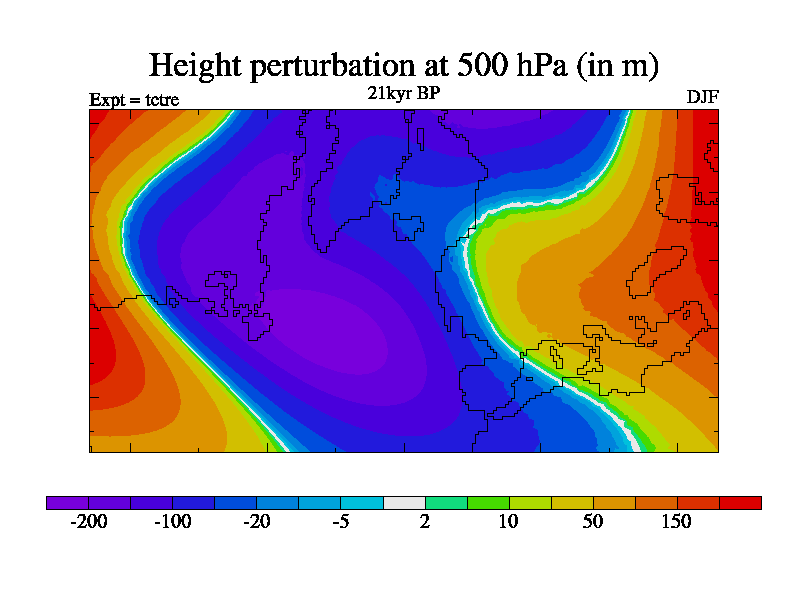
DJF
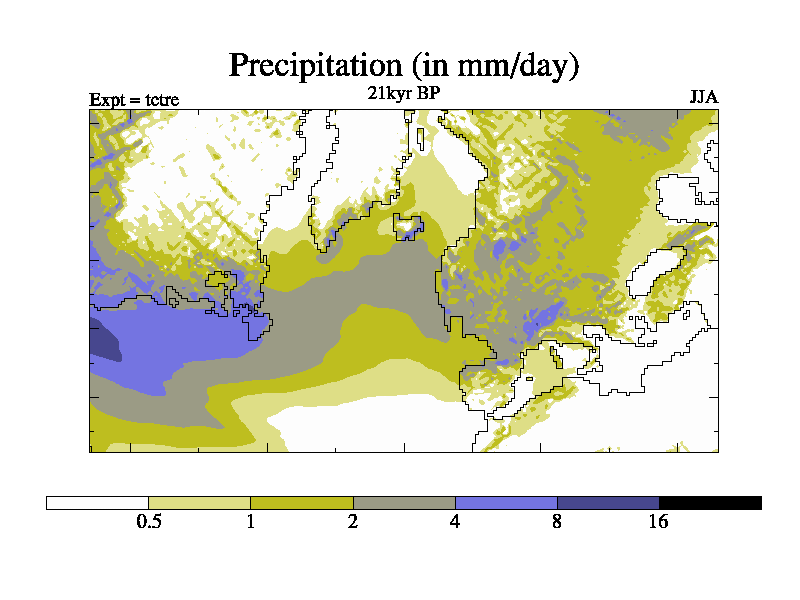
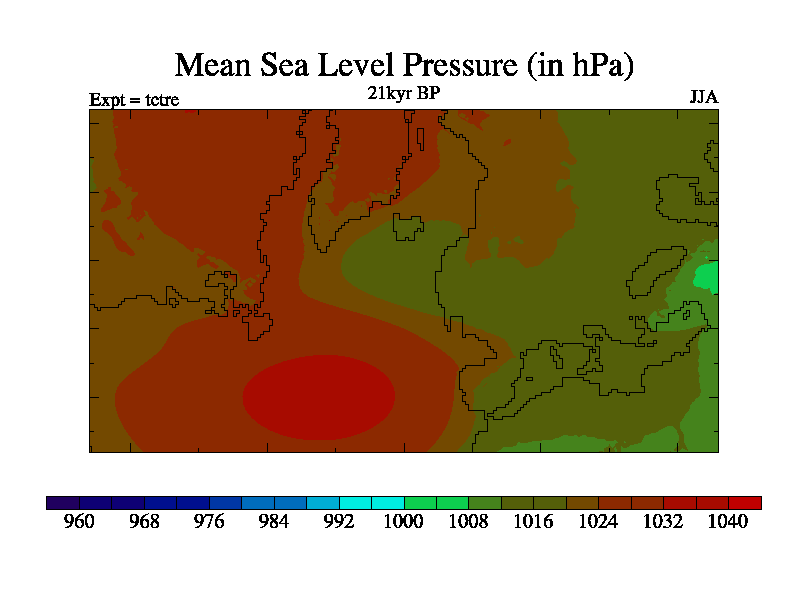
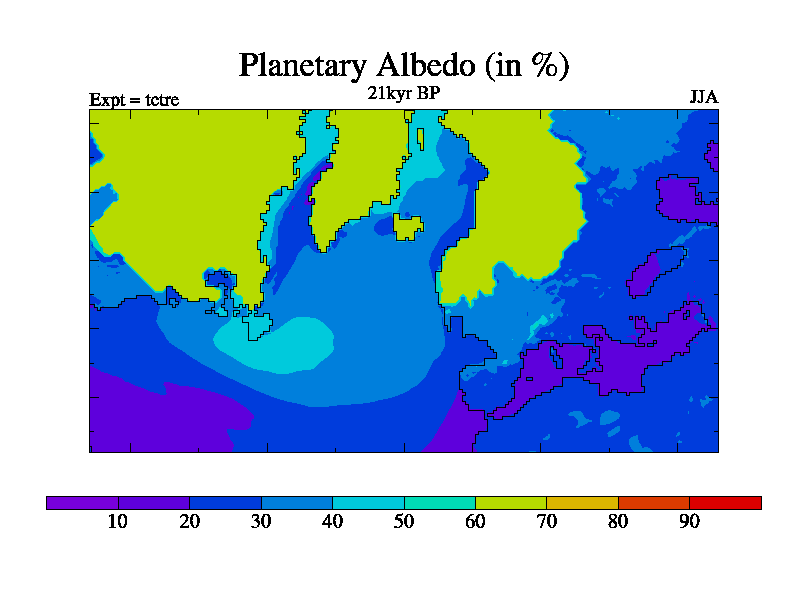
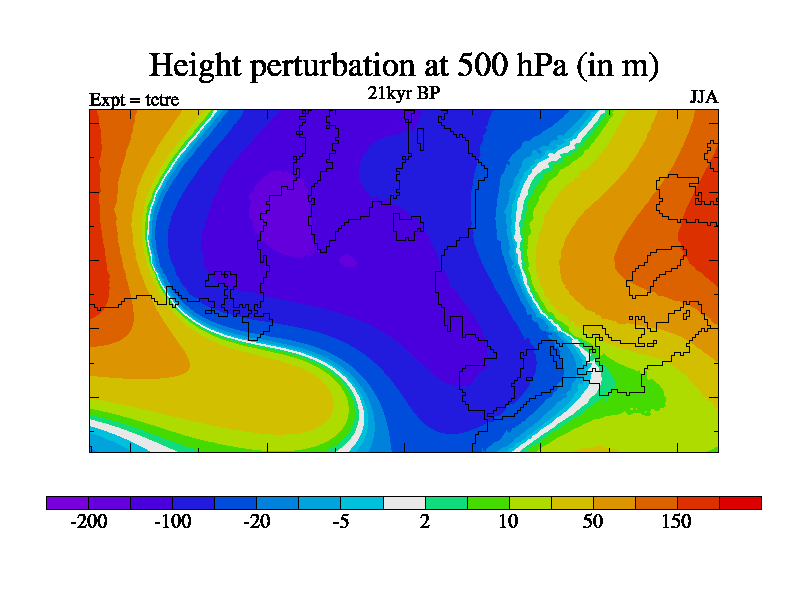
JJA
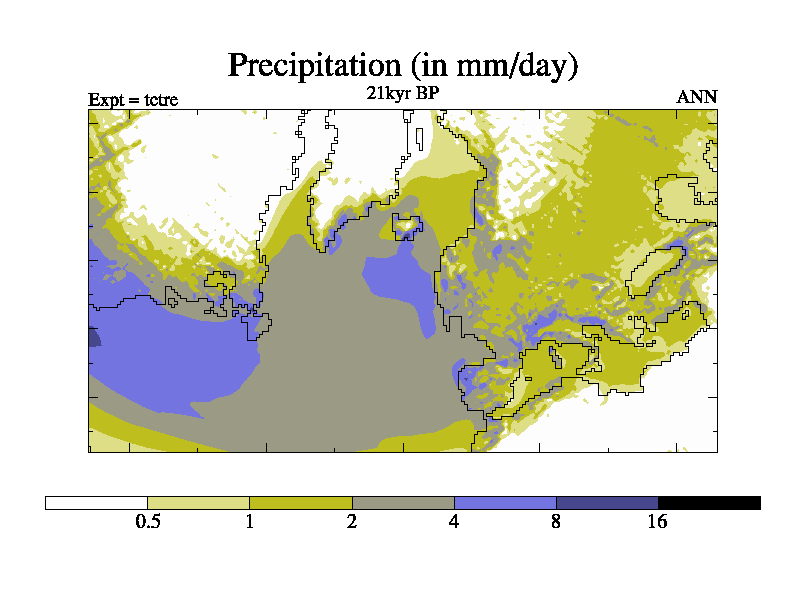
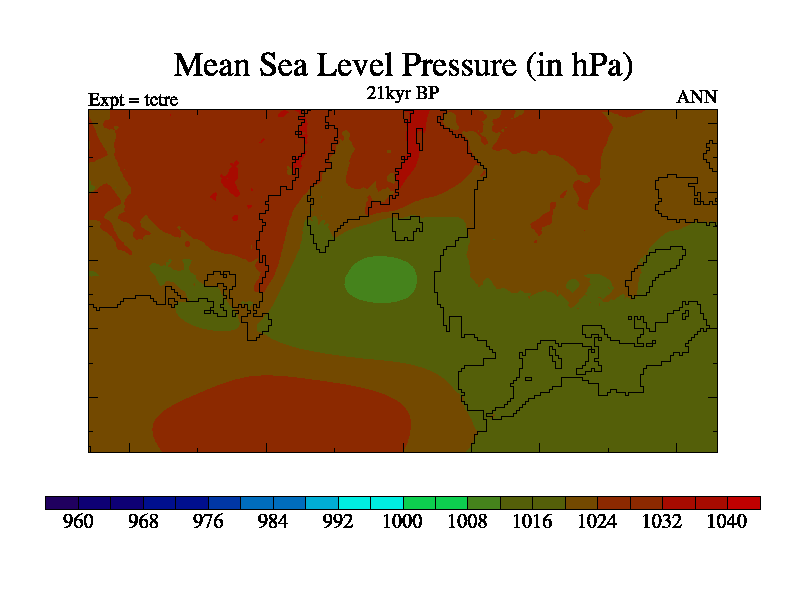
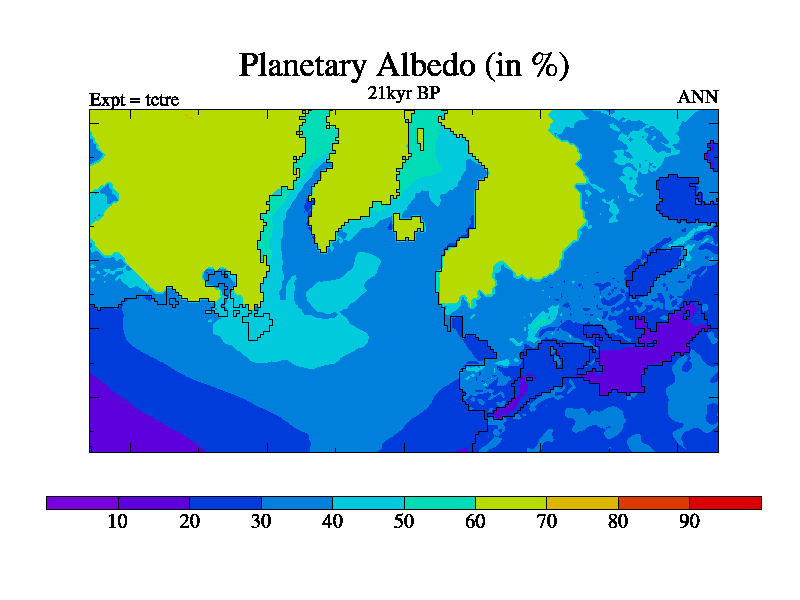
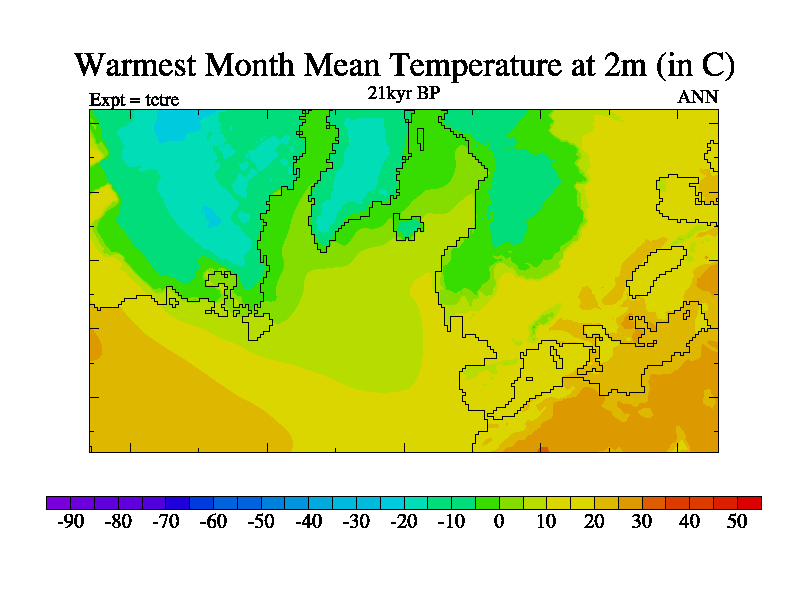
ANN
Monthly
Variable
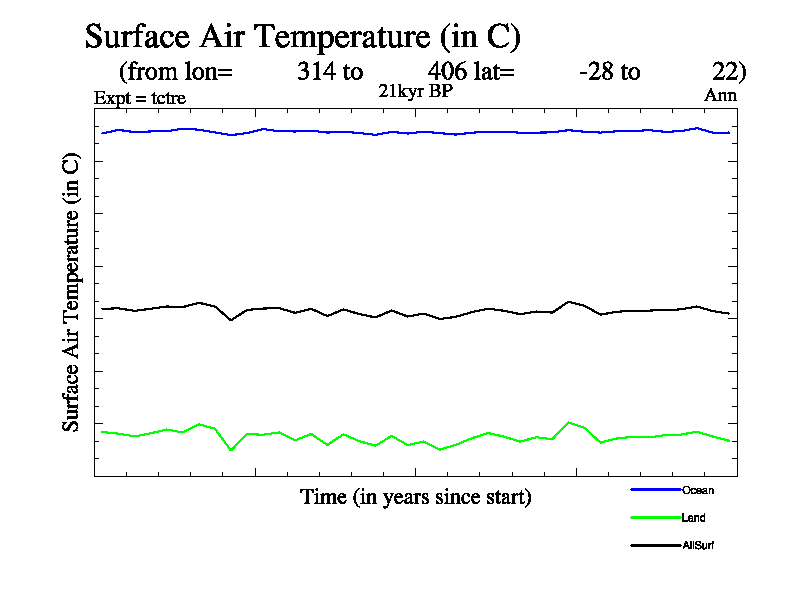
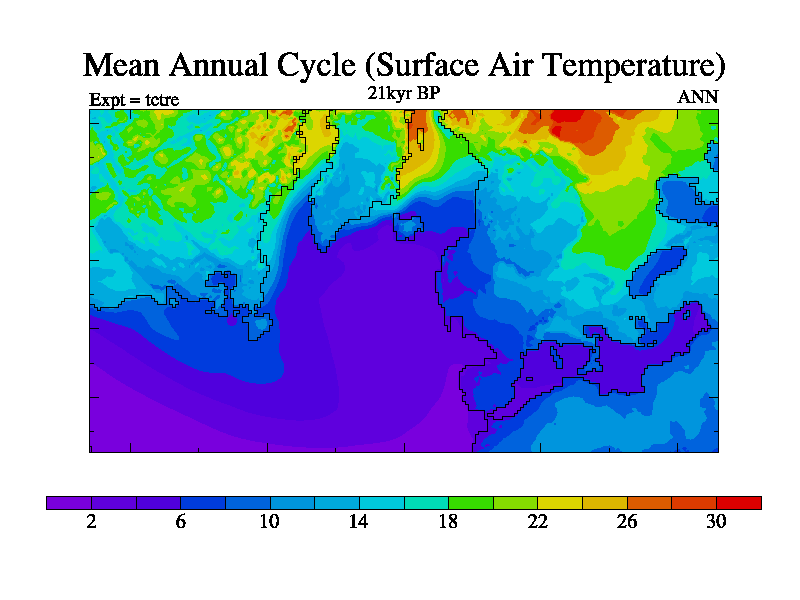
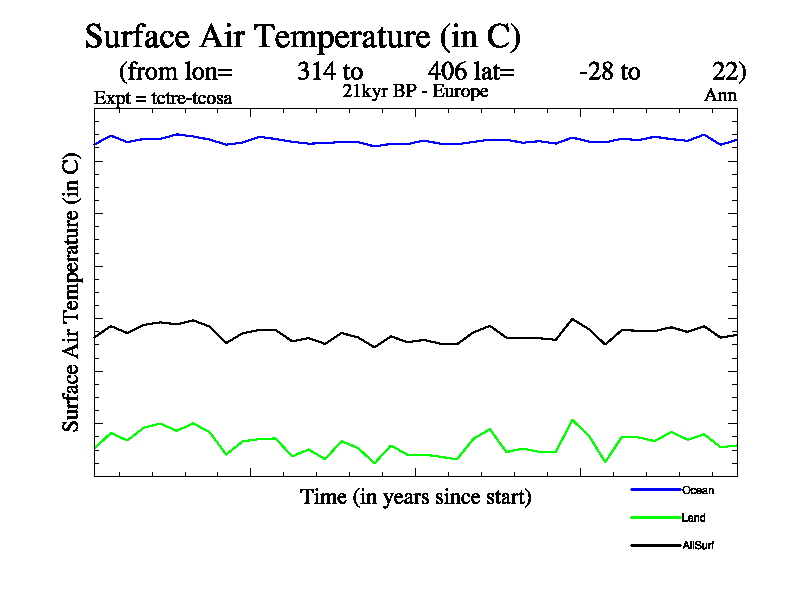
Surface Air Temperature
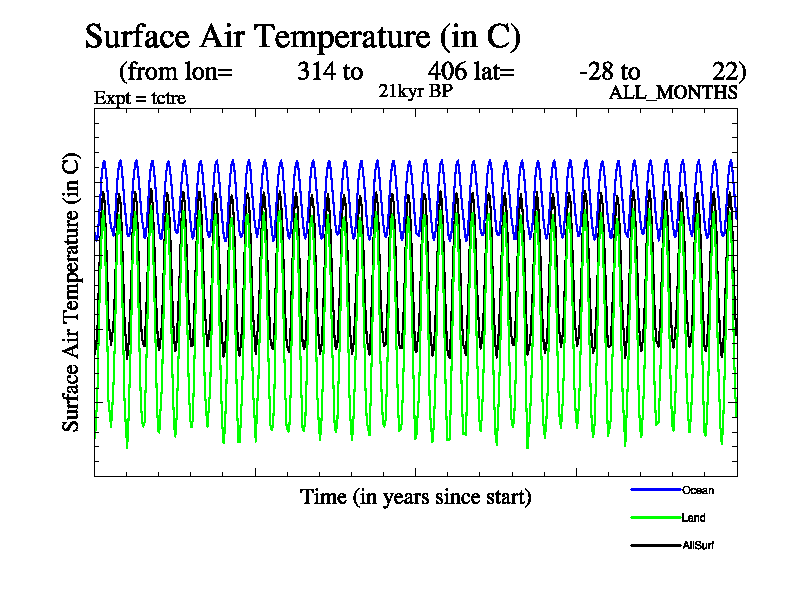
Surface Air Temperature Time Series
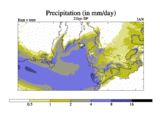
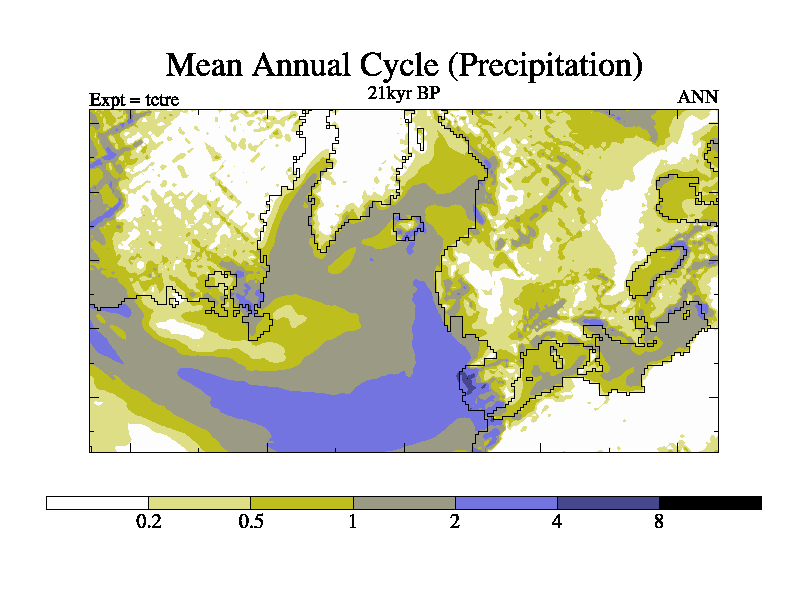
Total Precipitation
Surface Air Temperature Time Series (annual means)
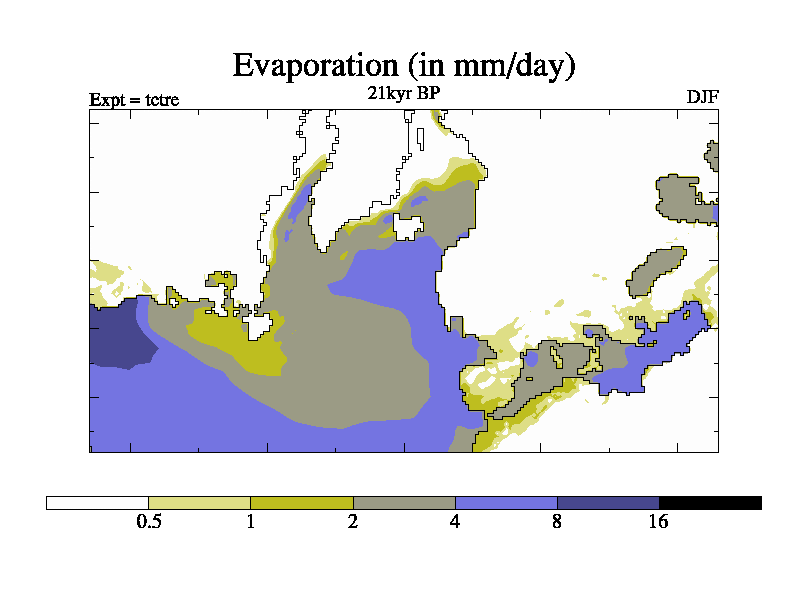
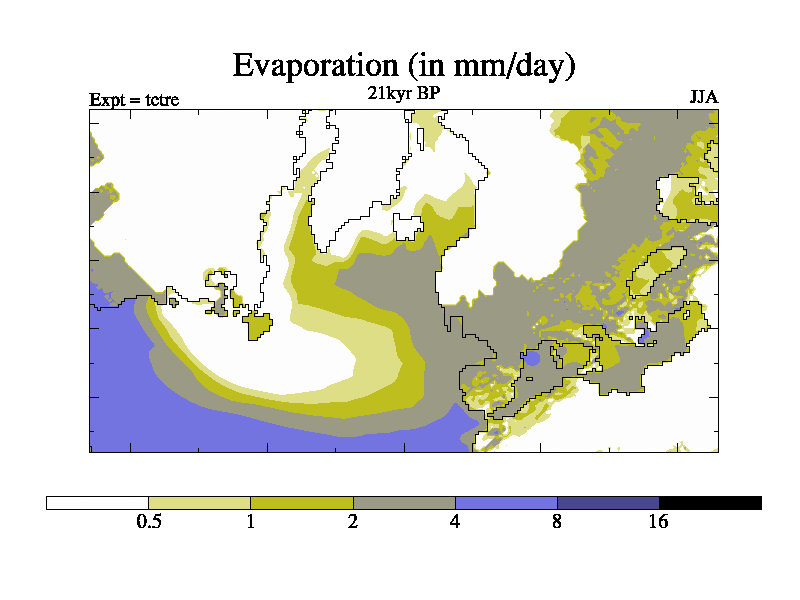
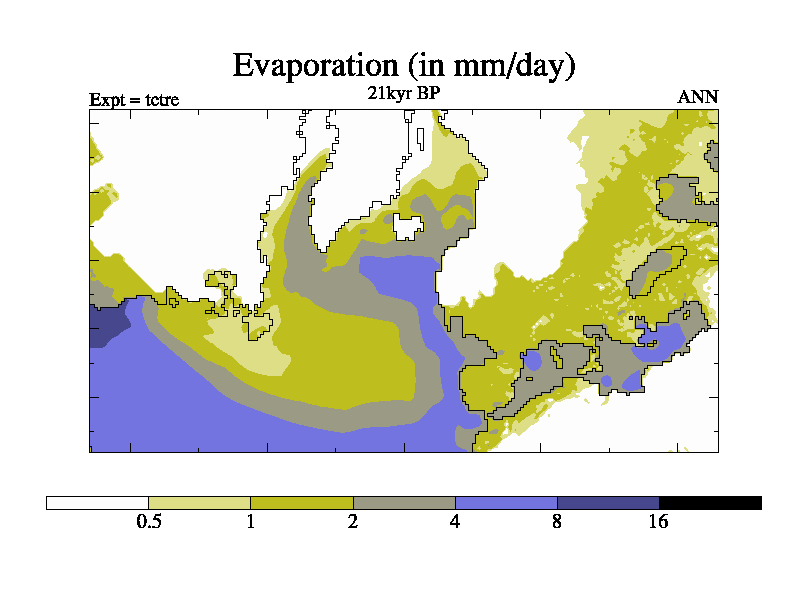
Evaporation
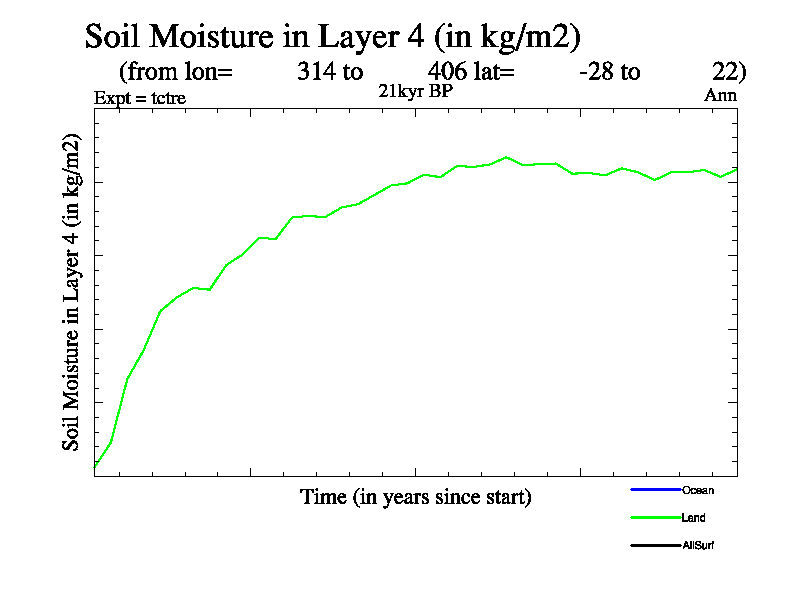
Soil Moisture in Layer 4 (Deepest layer)
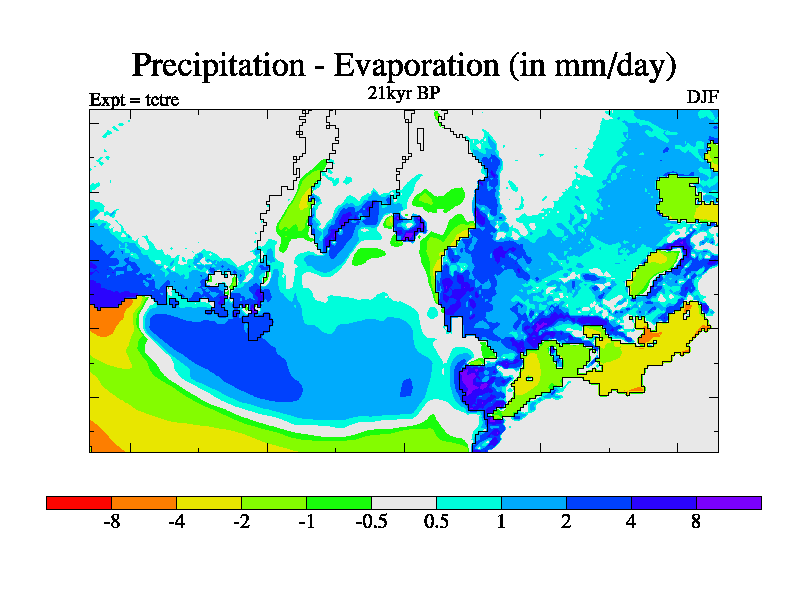
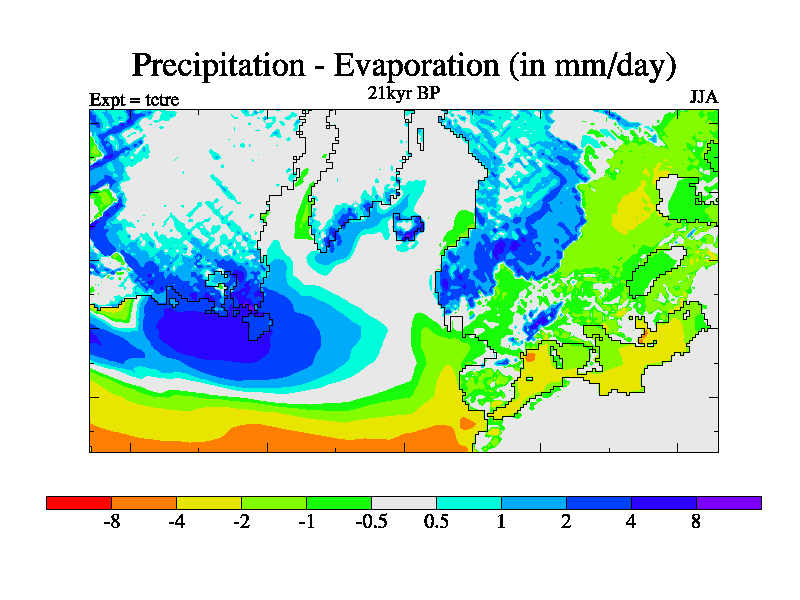
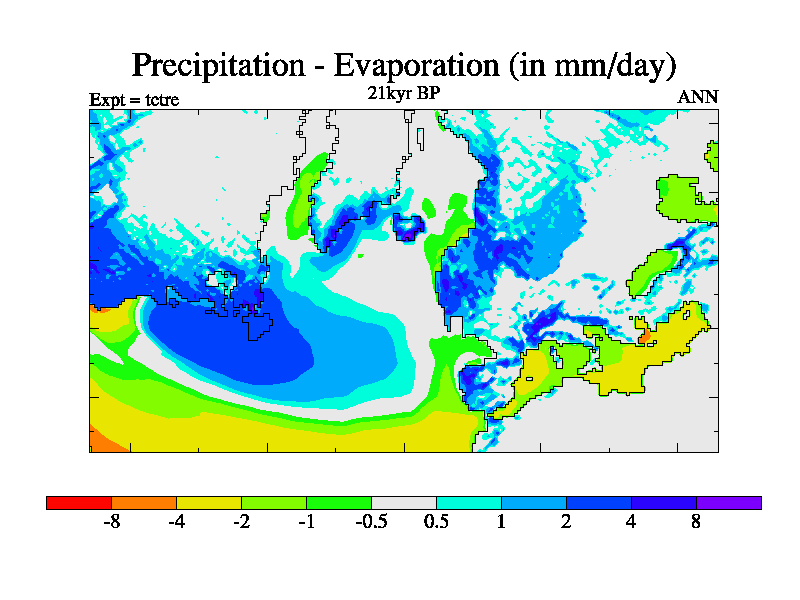
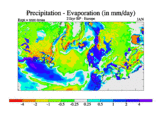
Precipitation - Evaporation
Soil Moisture in Layer 4 (Deepest layer) (annual means)
Fractional Plant Stress (layer 1)
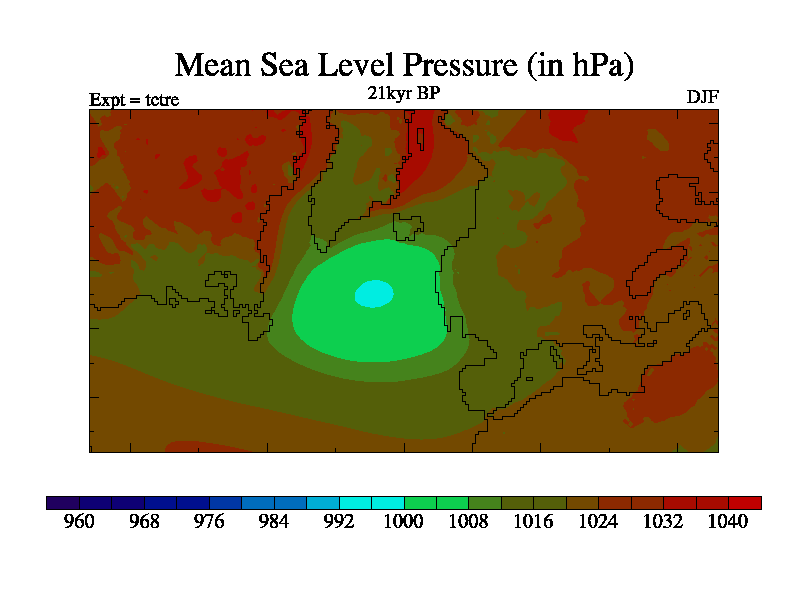
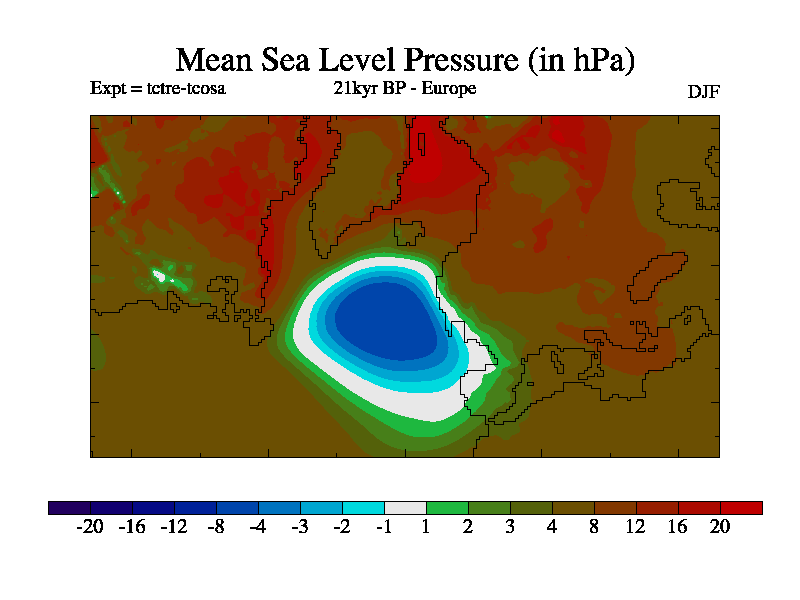
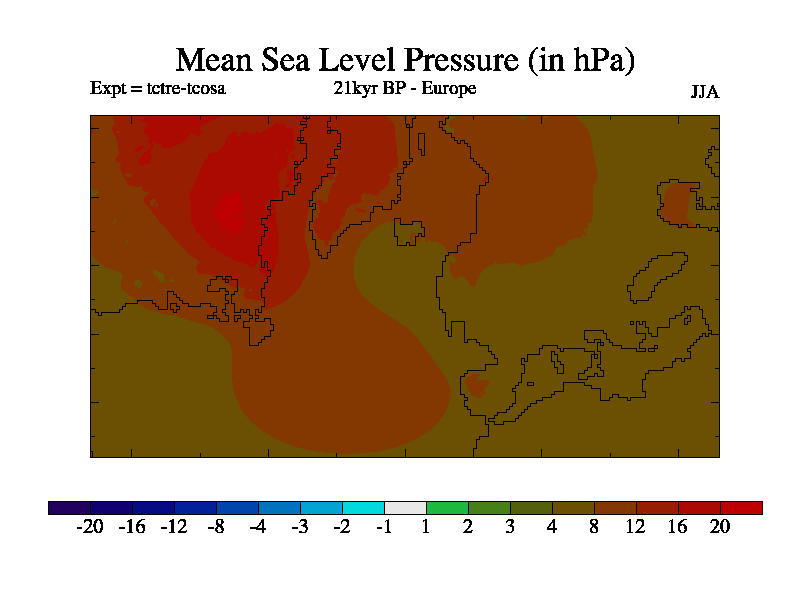
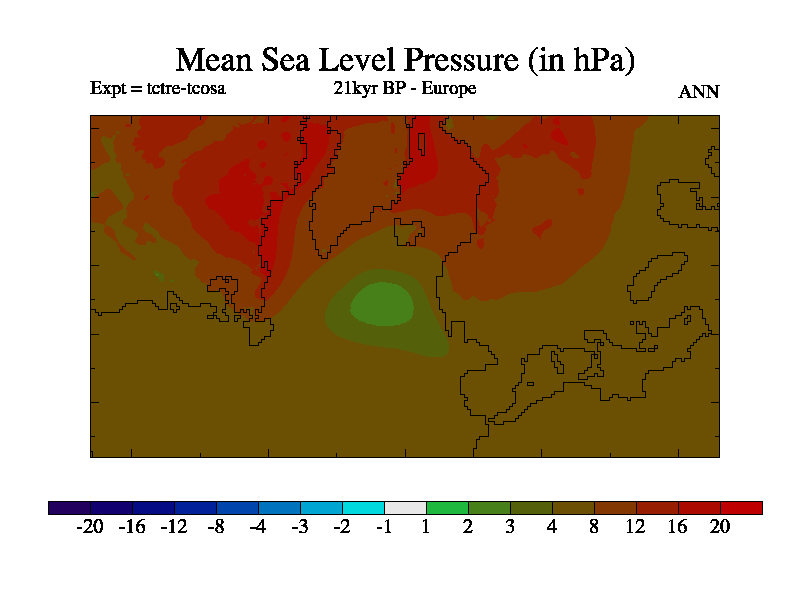
Mean Sea Level Pressure
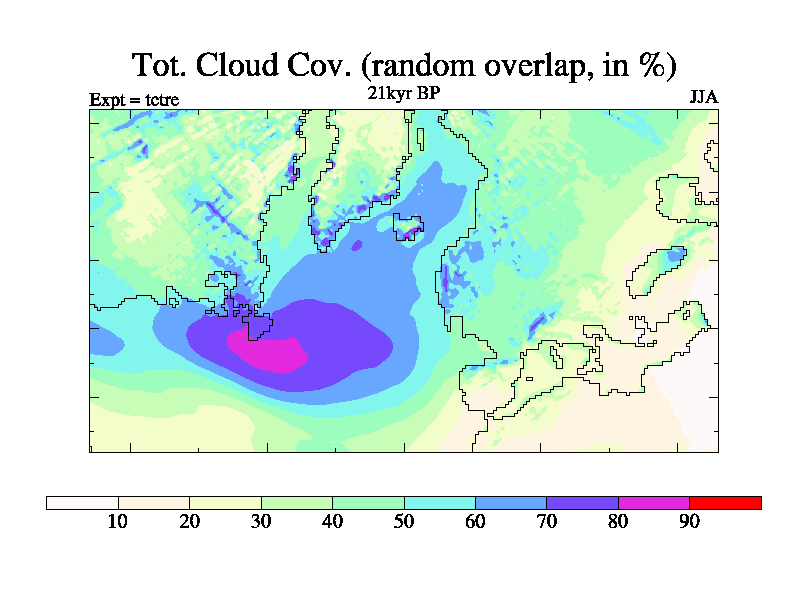
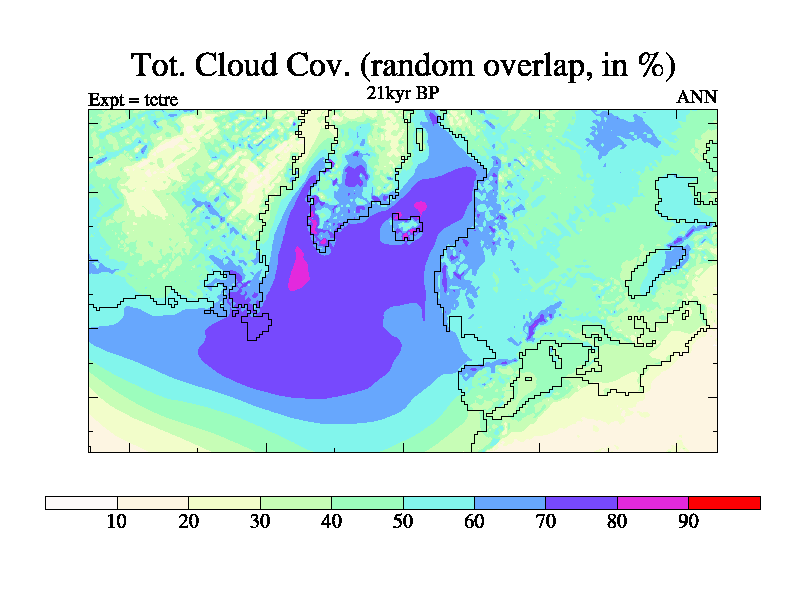
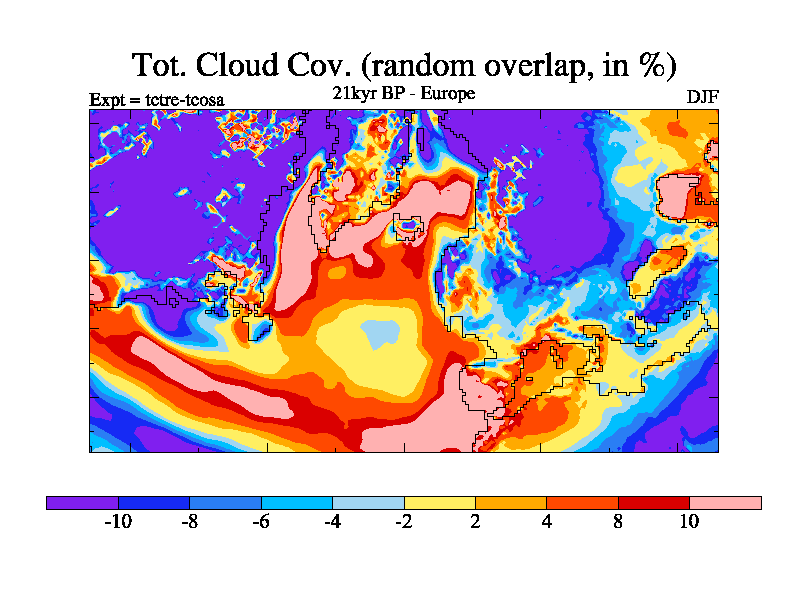
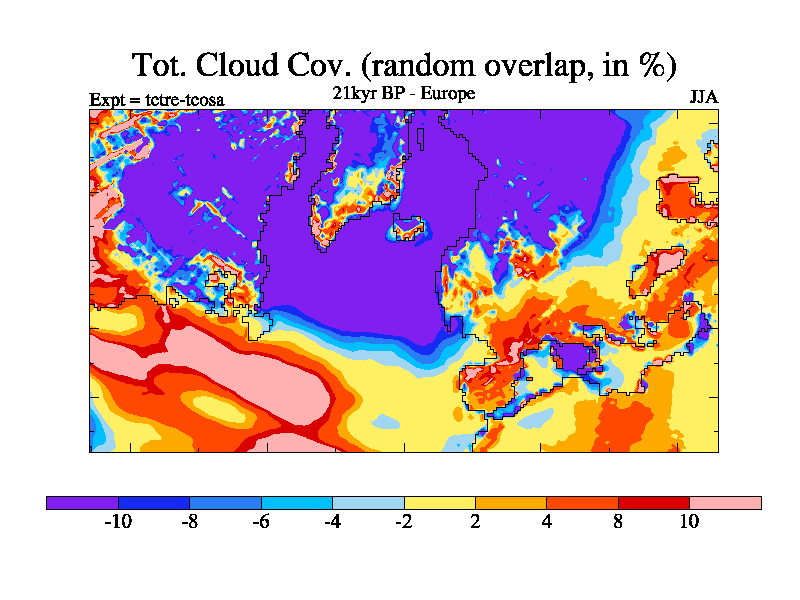
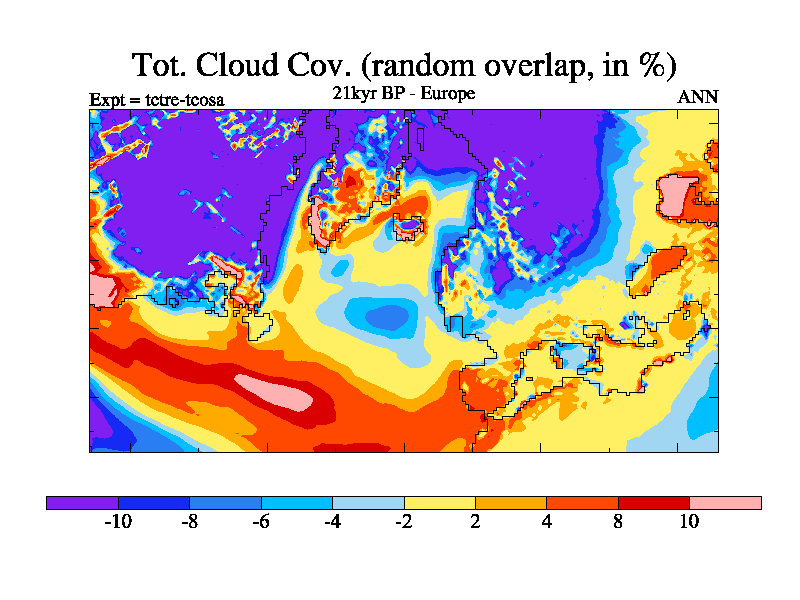
Total Cloud Cover
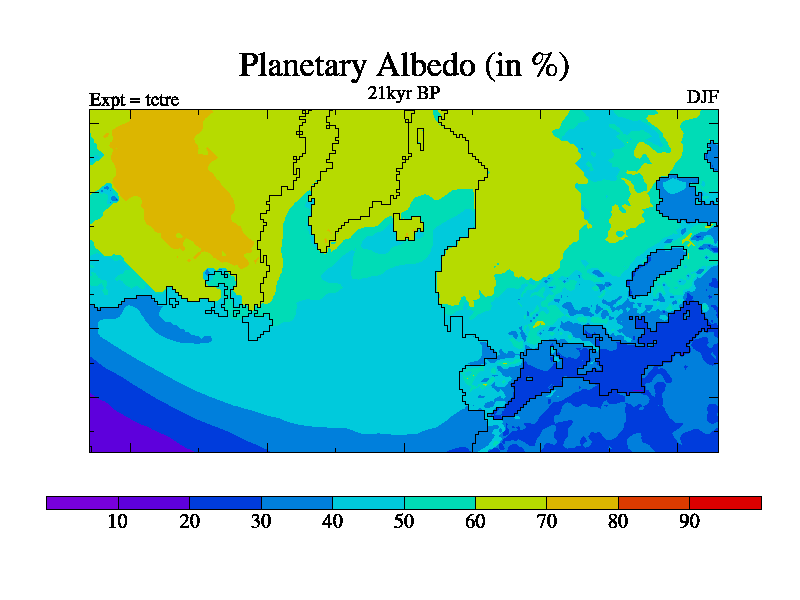
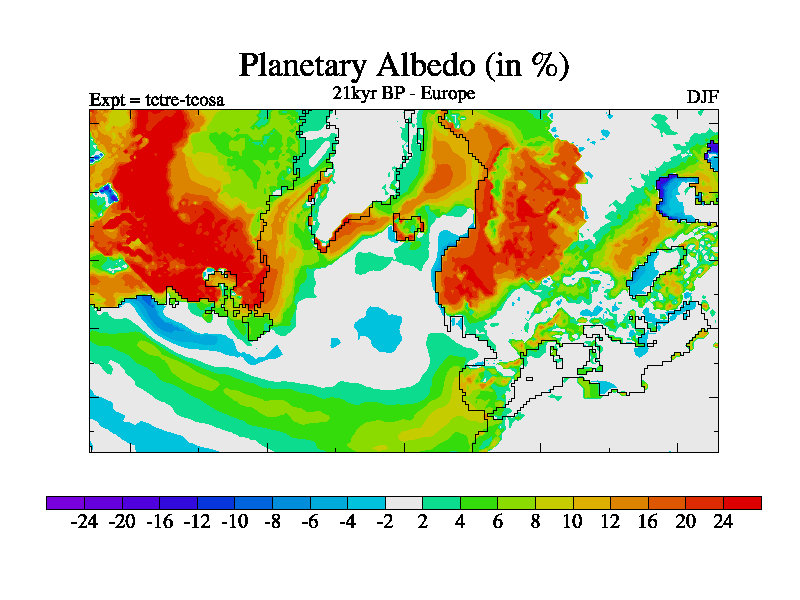
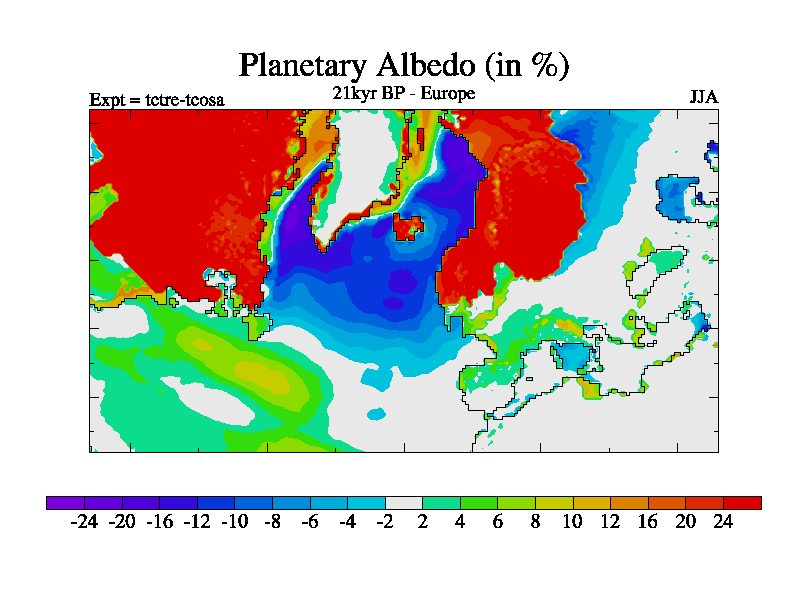
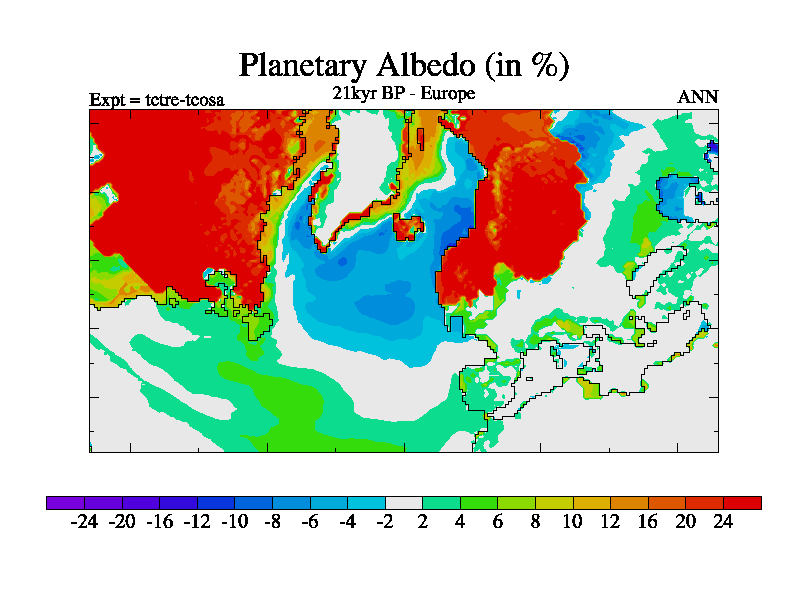
Plantary Albedo
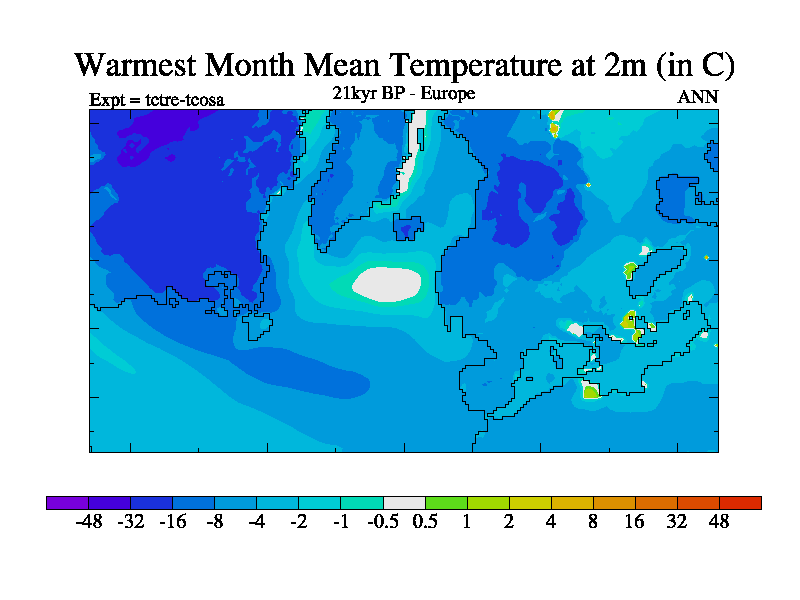
Warm Month Mean
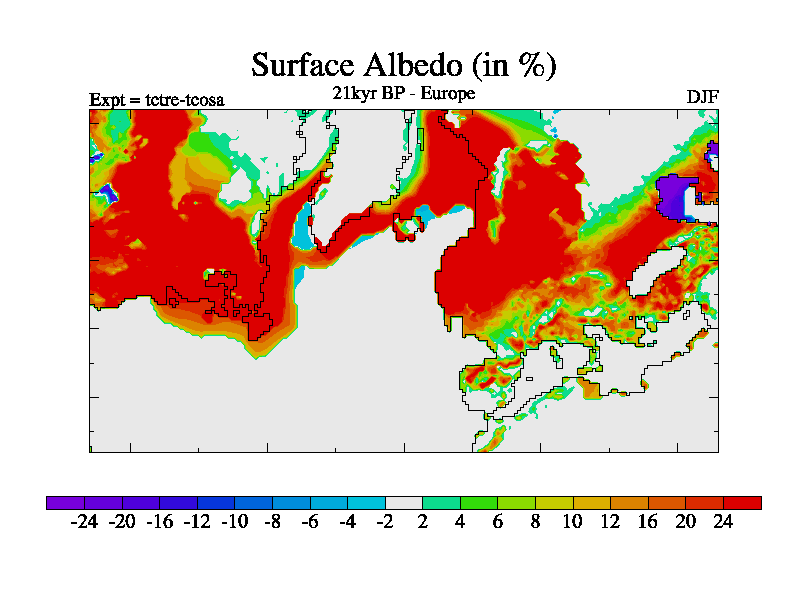
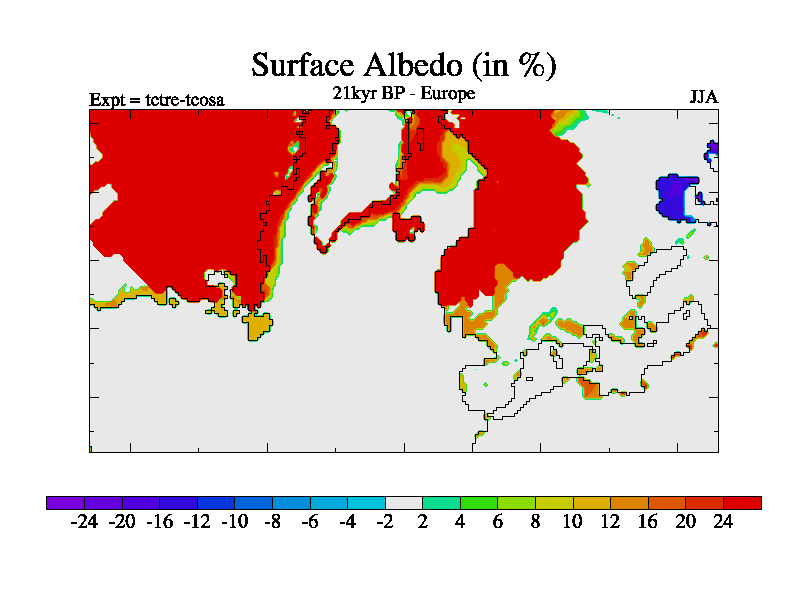
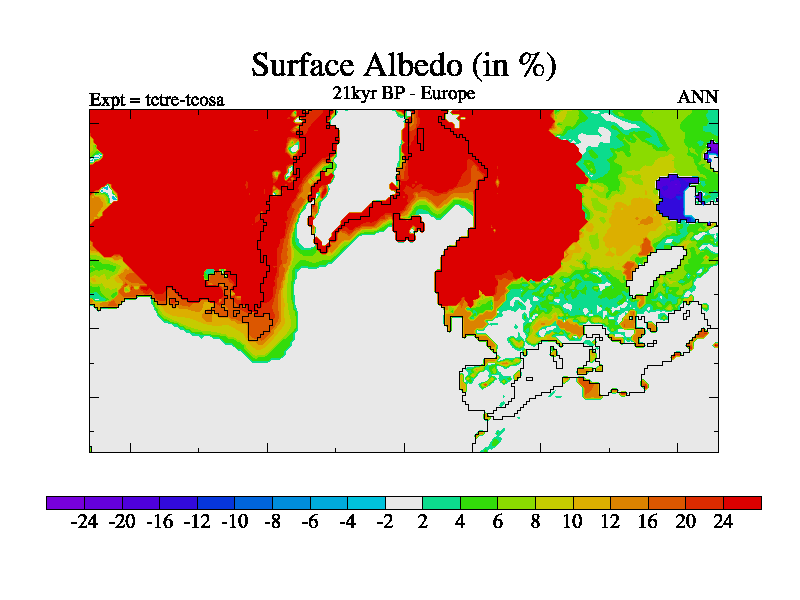
Surface Albedo
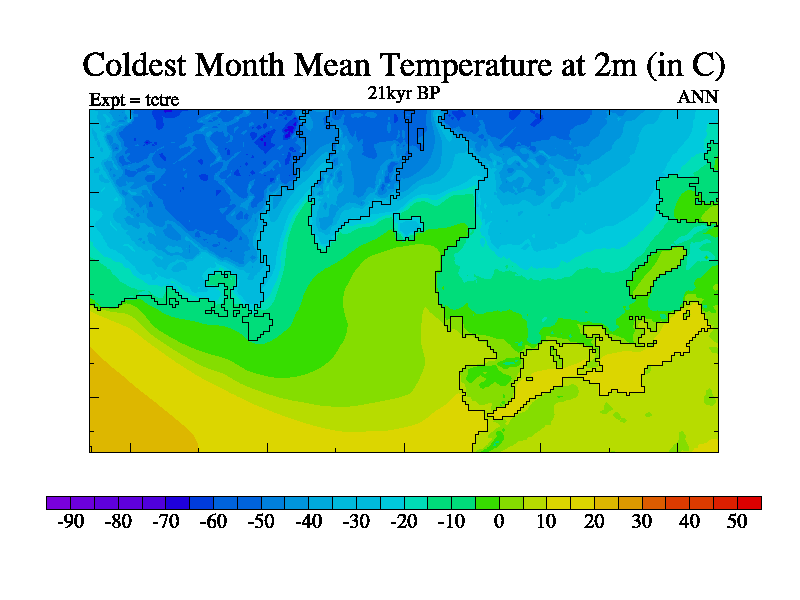
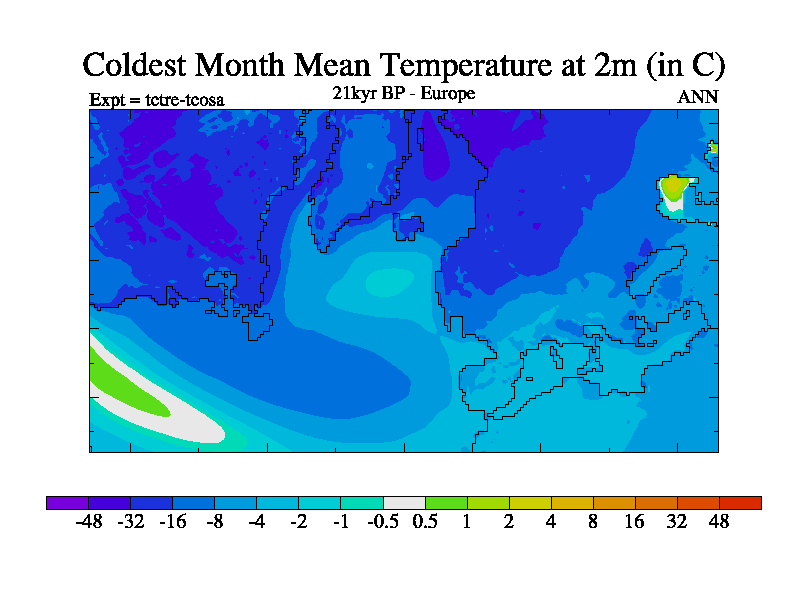
Cold Month Mean
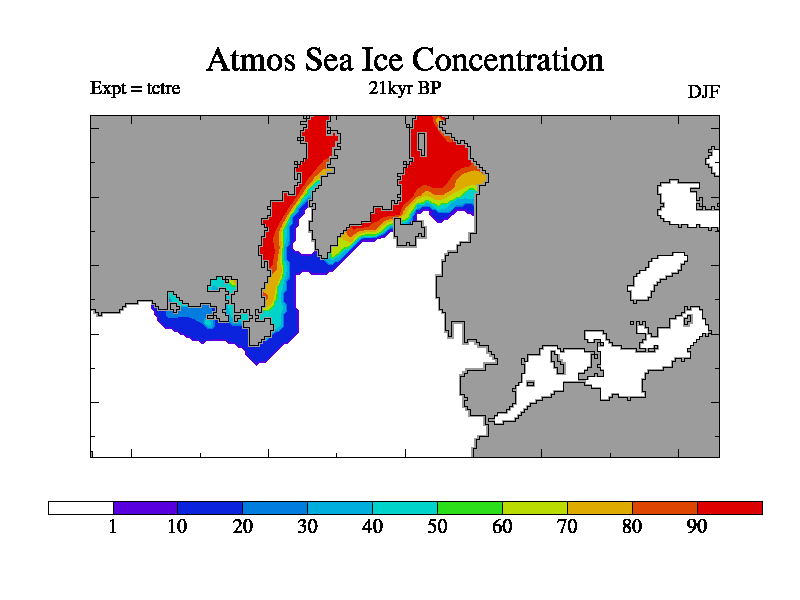
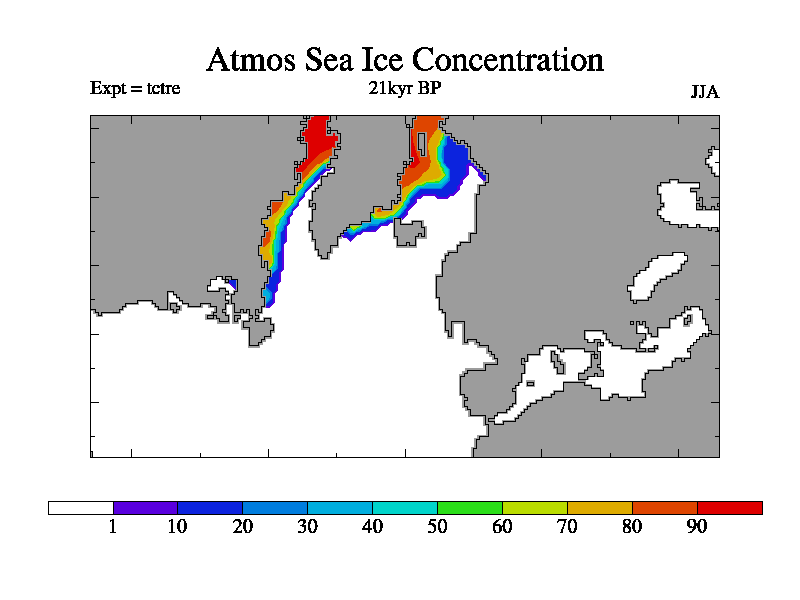
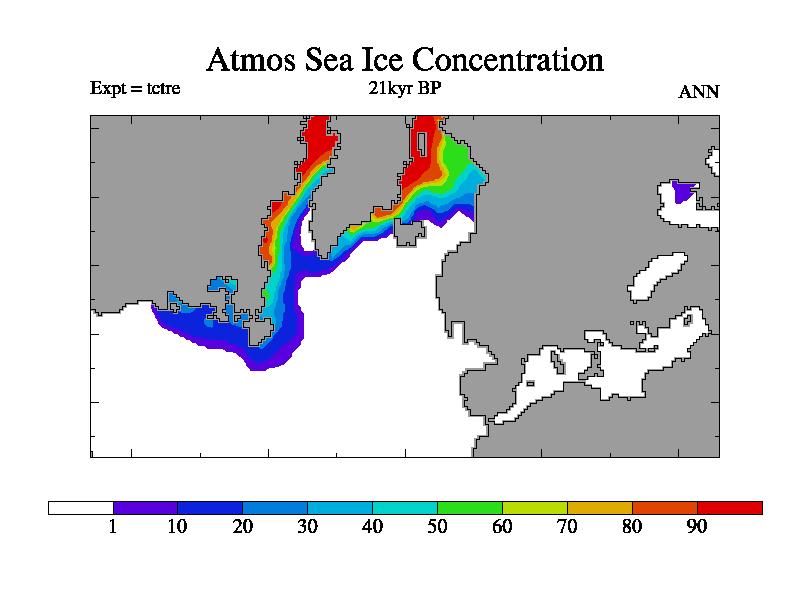
Sea Ice Concentration
Mean Annual Temperature Cycle
Mean Annual Precipitation Cycle
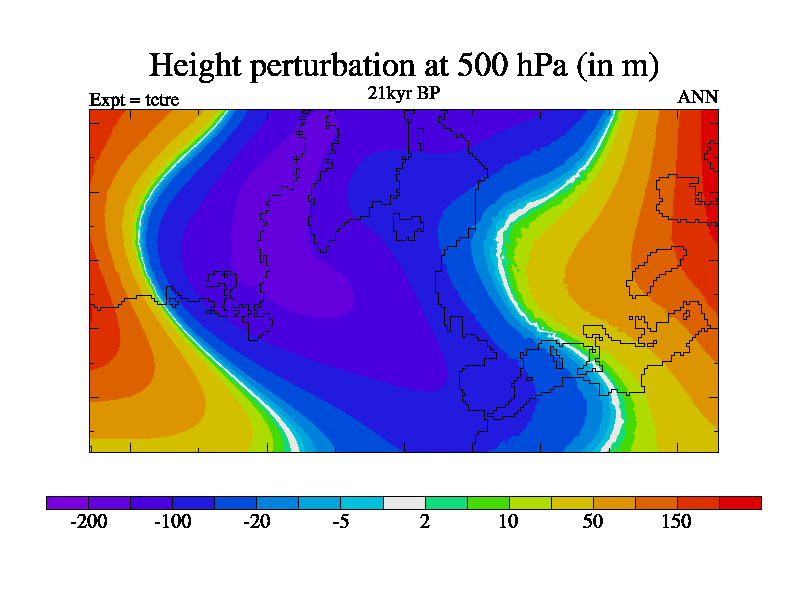
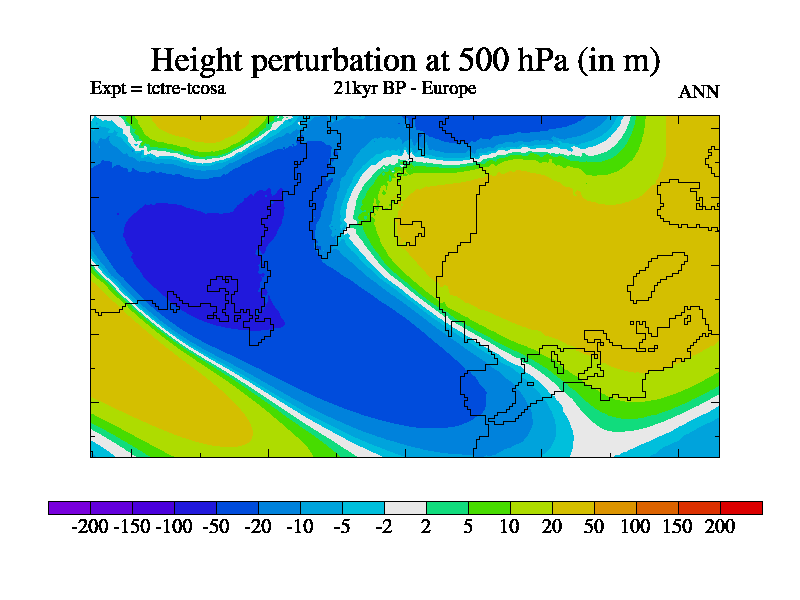
Perturbation Height at 500 hPa
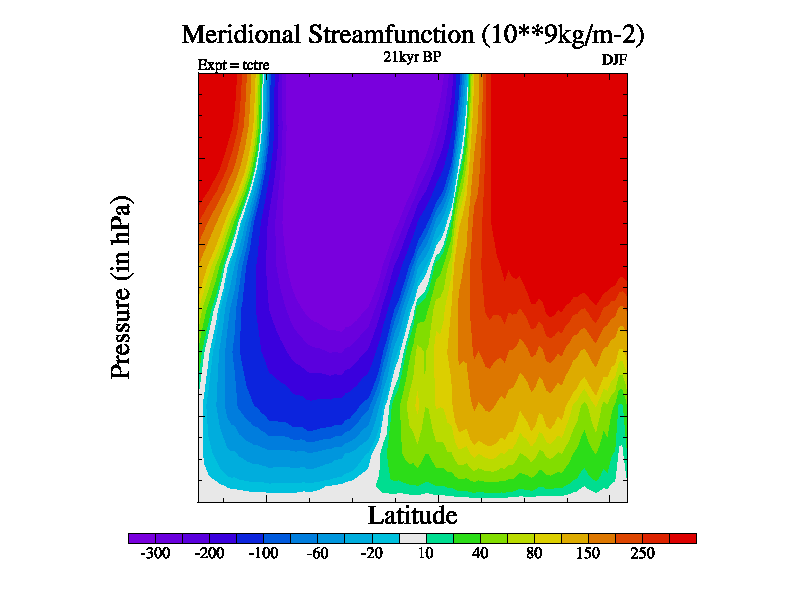
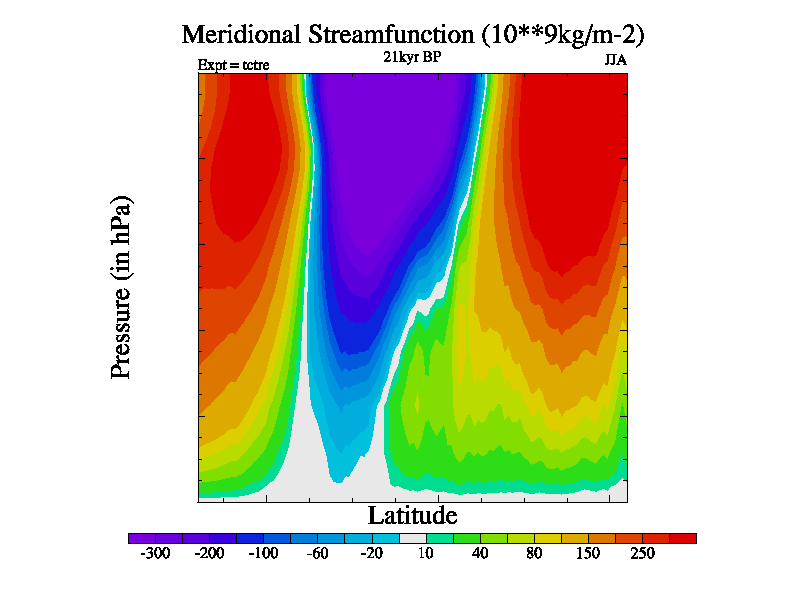
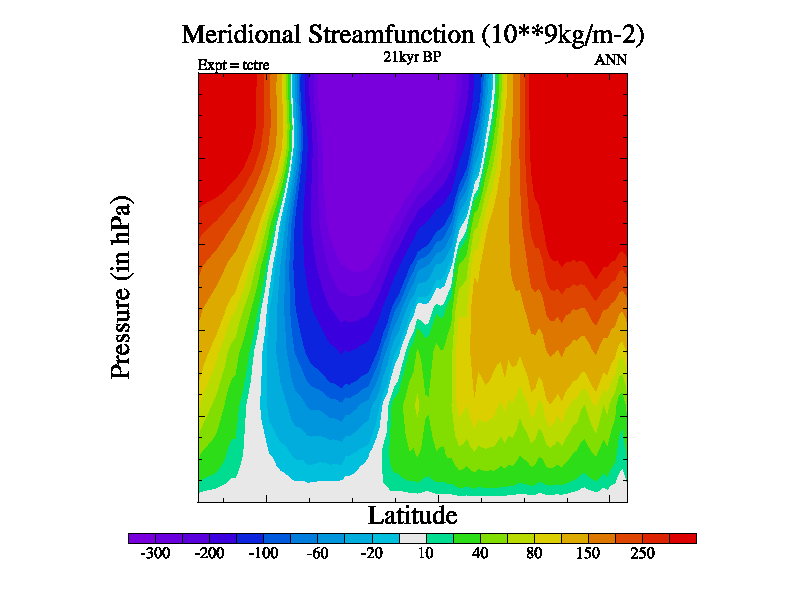
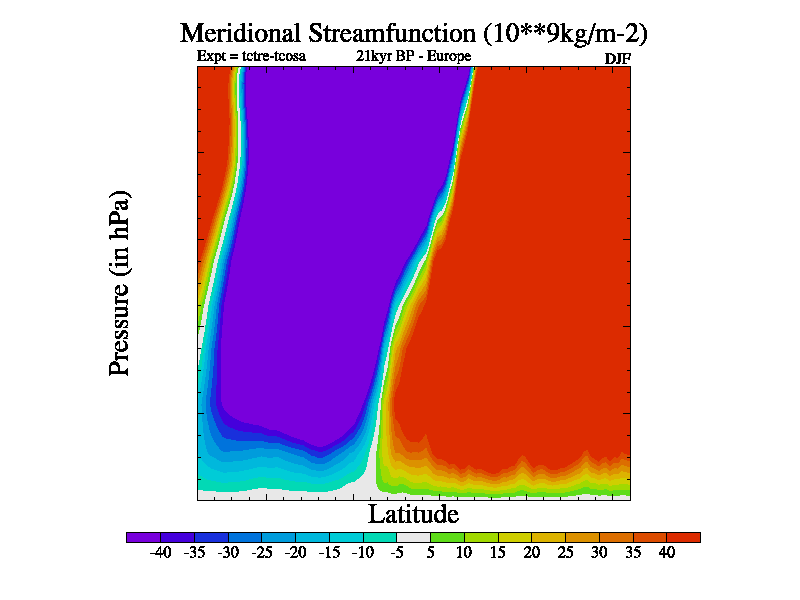
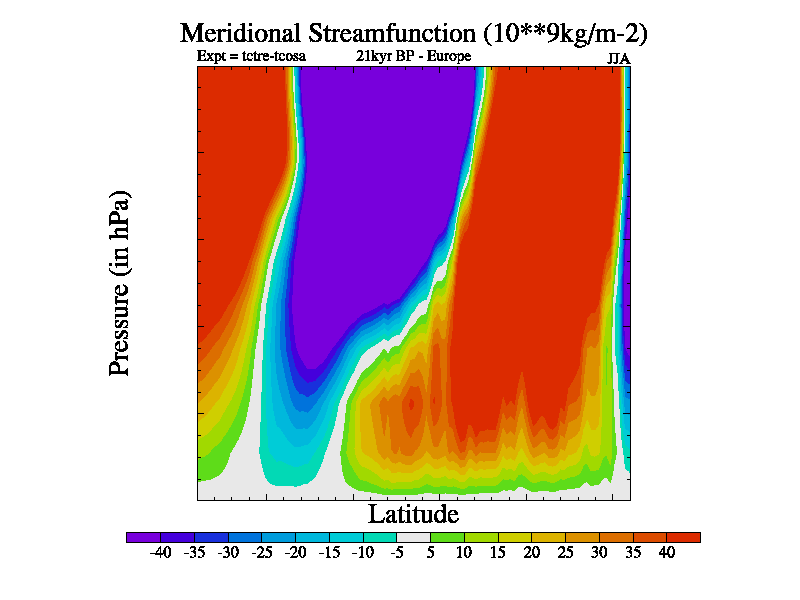
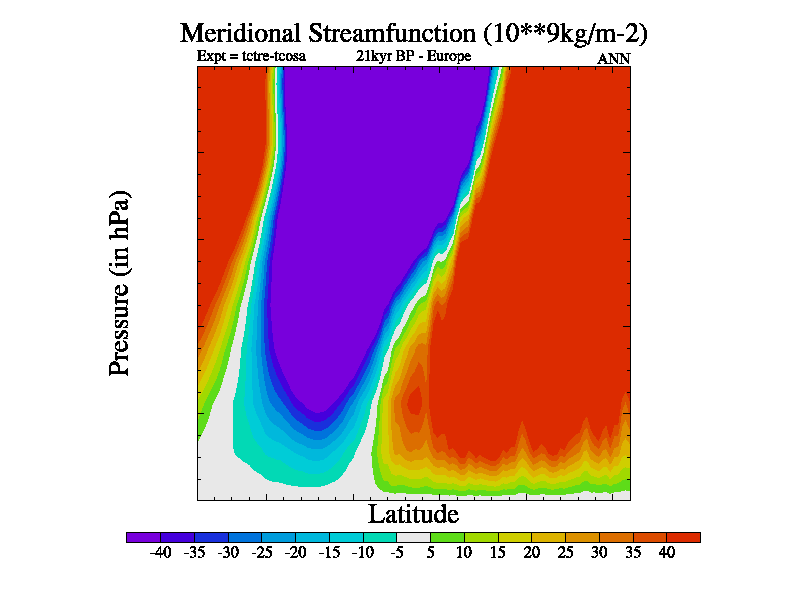
Meridional Stream Function
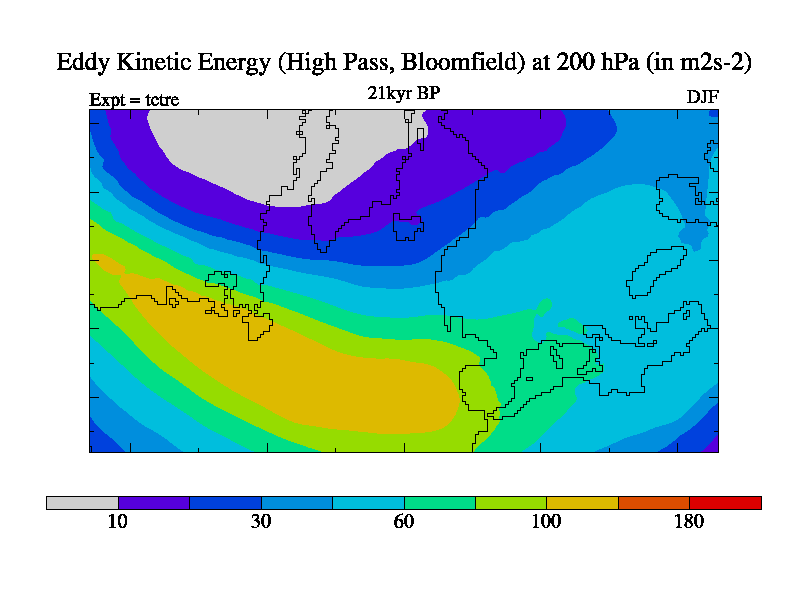
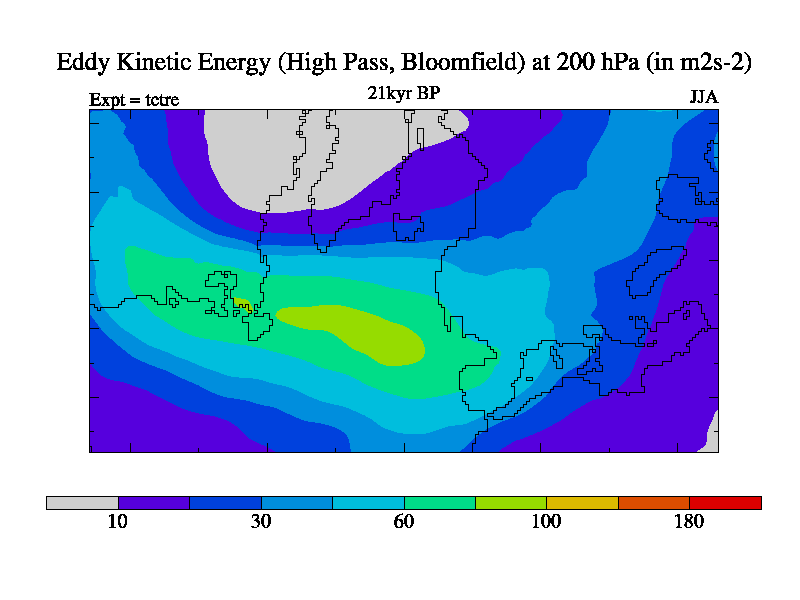
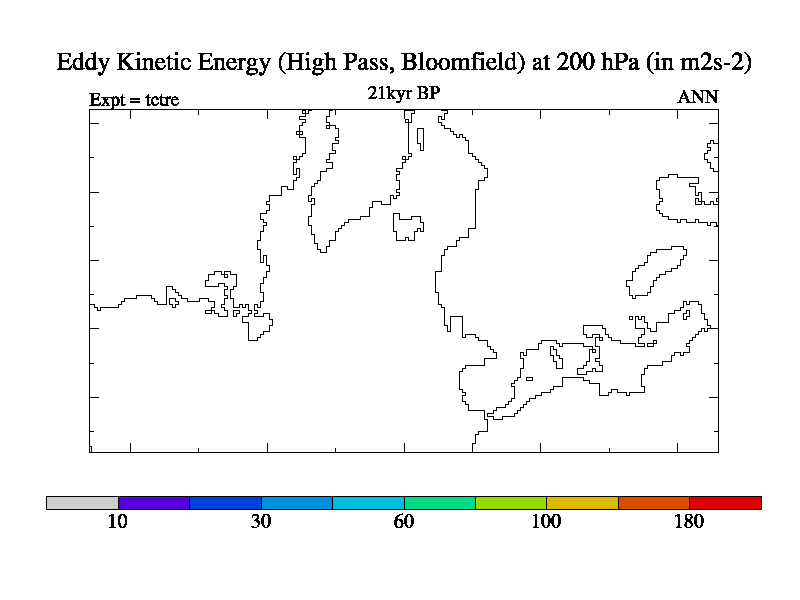
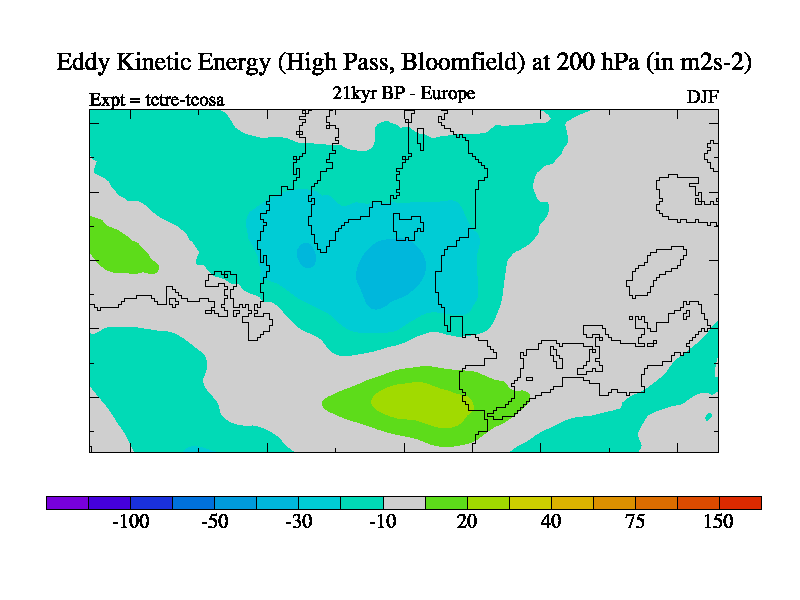
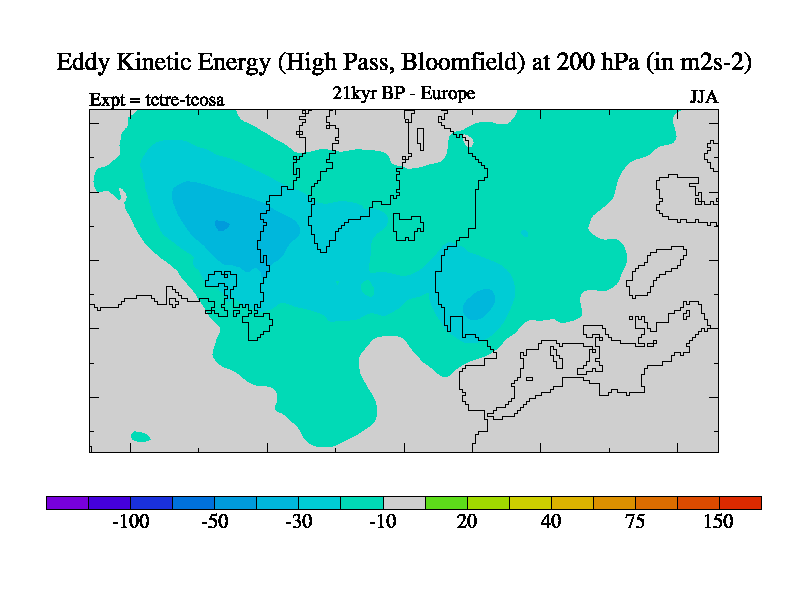
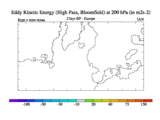
High Pass Eddy Kinetic Energy at 200 hPa
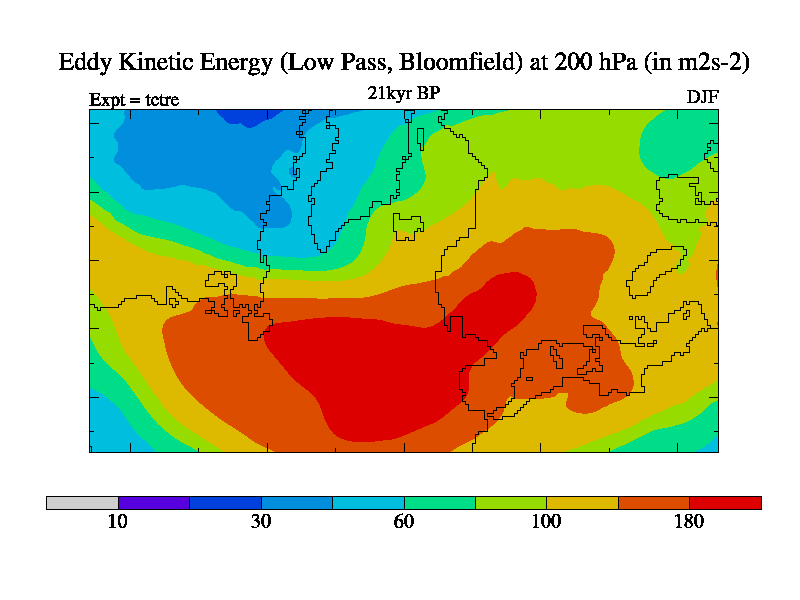
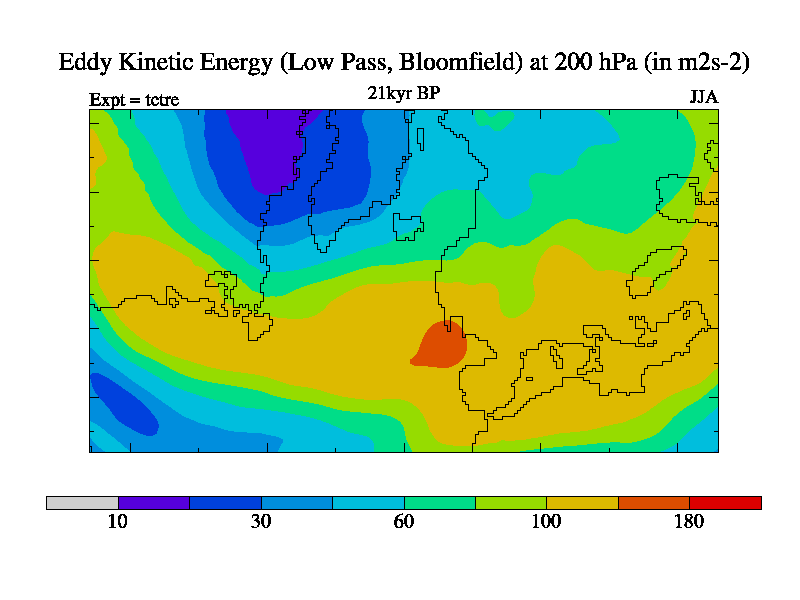
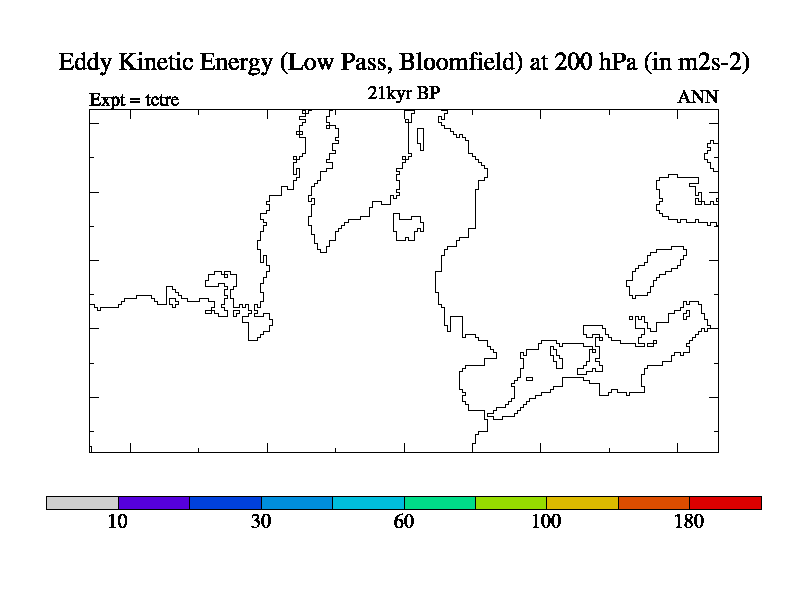
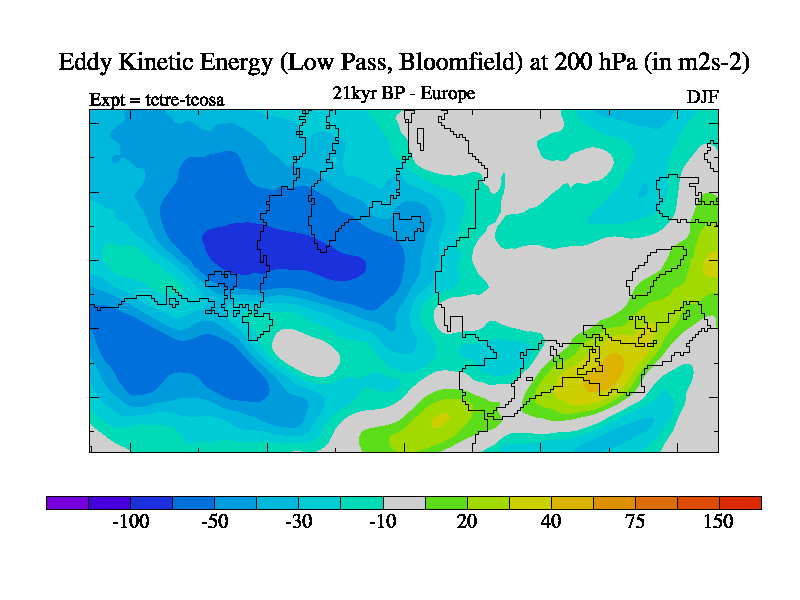
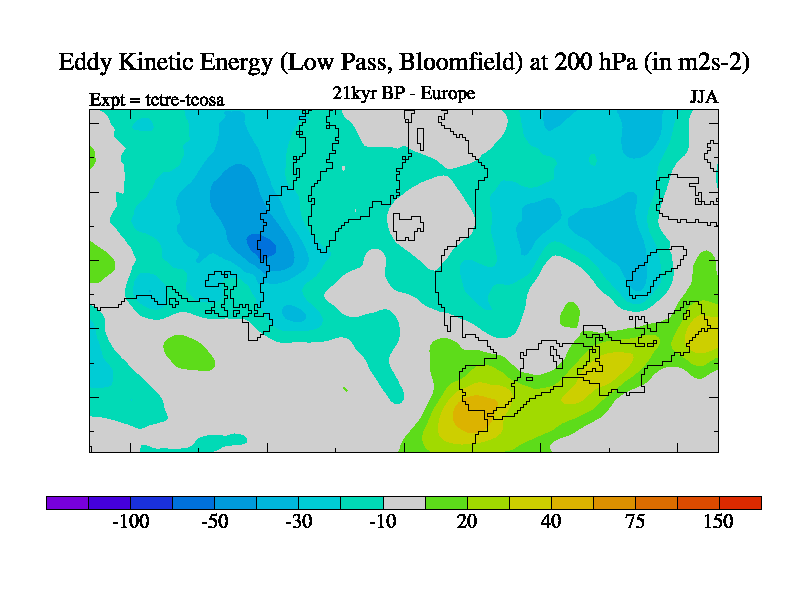
Low Pass Eddy Kinetic Energy at 200 hPa
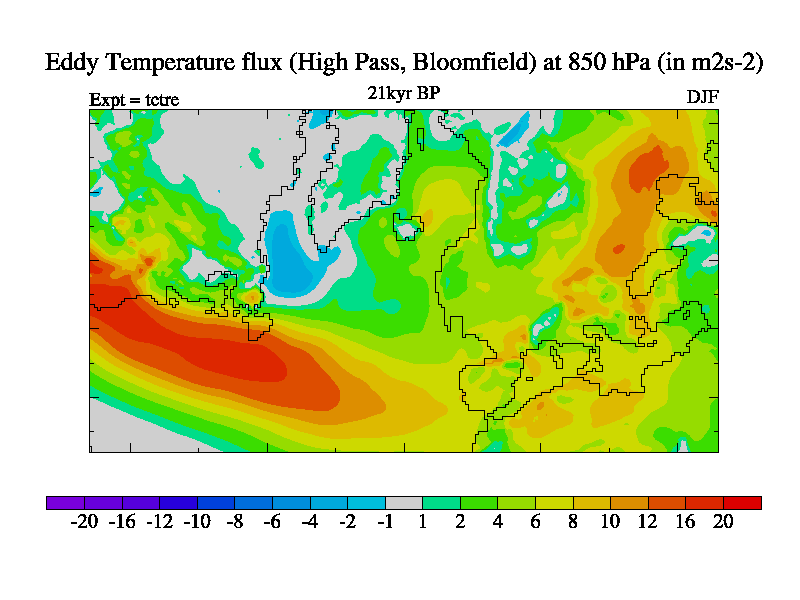
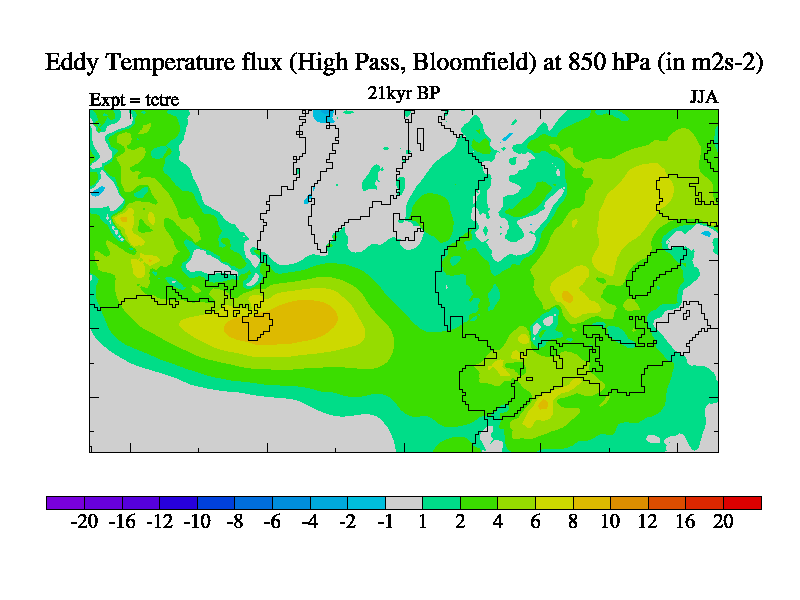
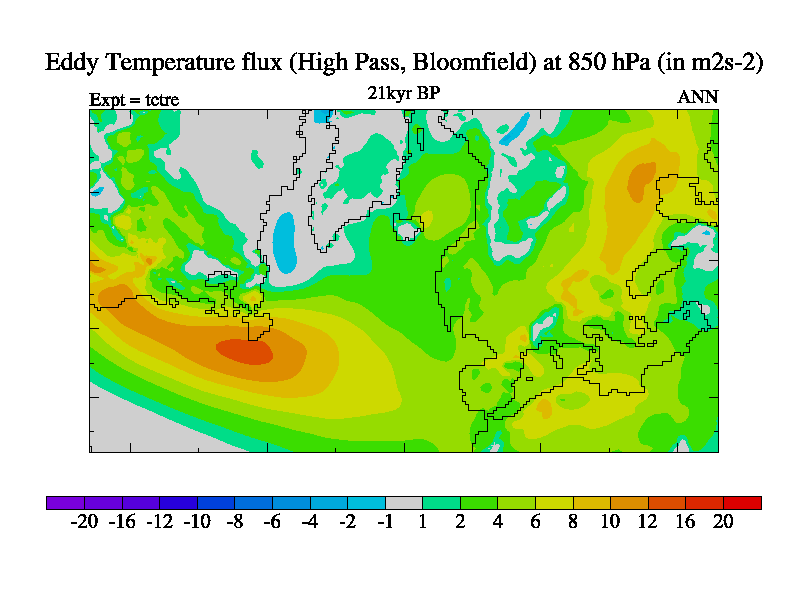
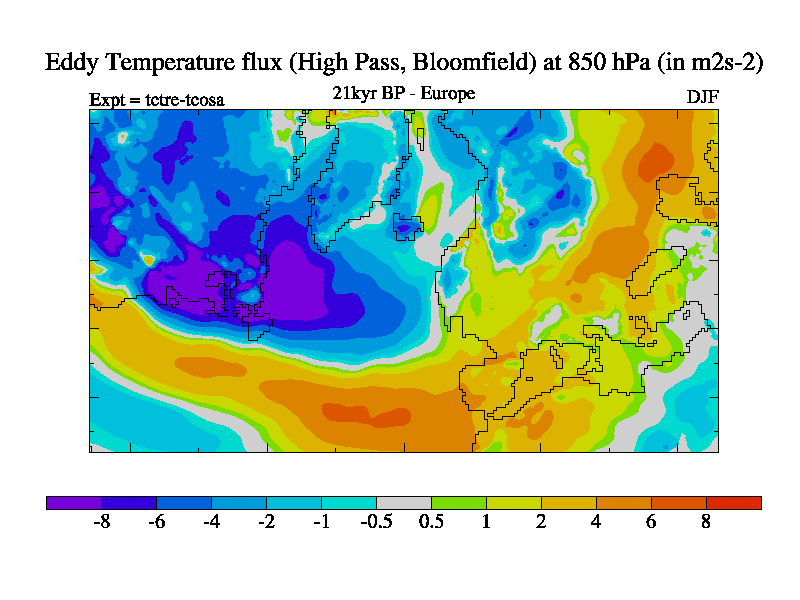
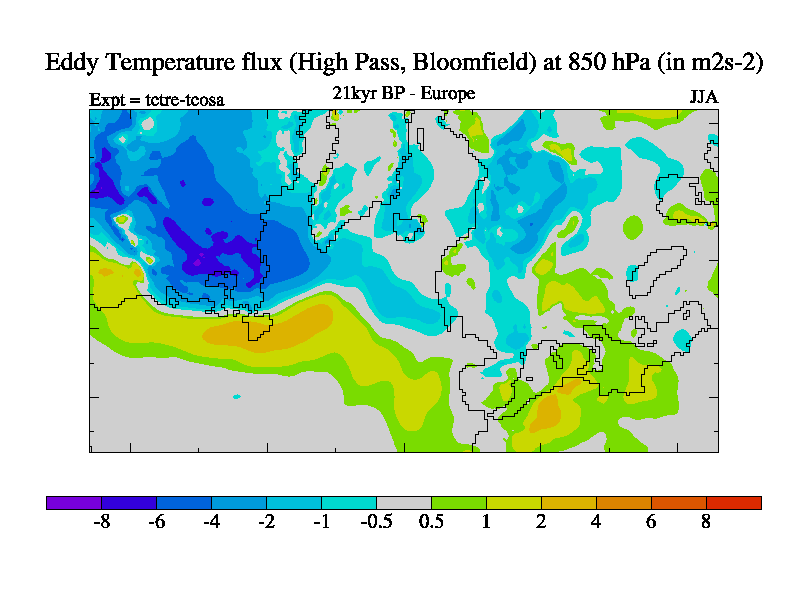
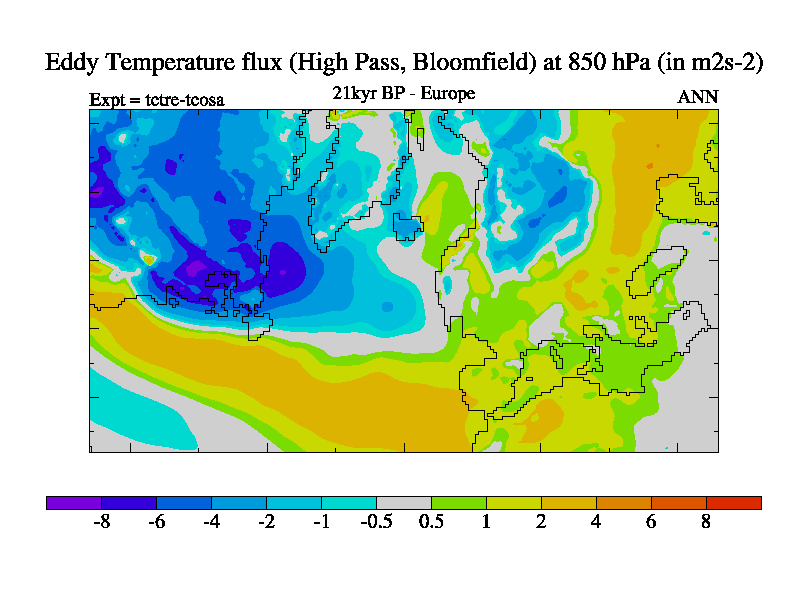
High Pass Temperature Flux at 850 hPa
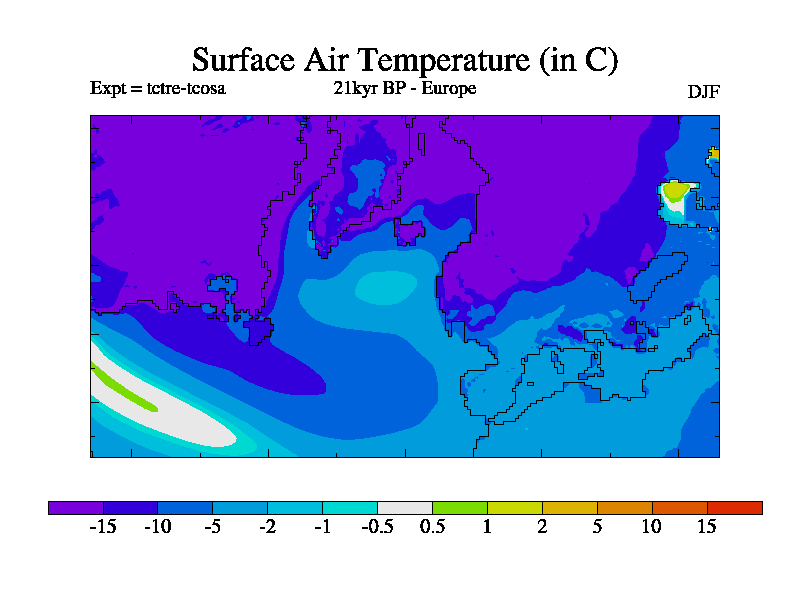
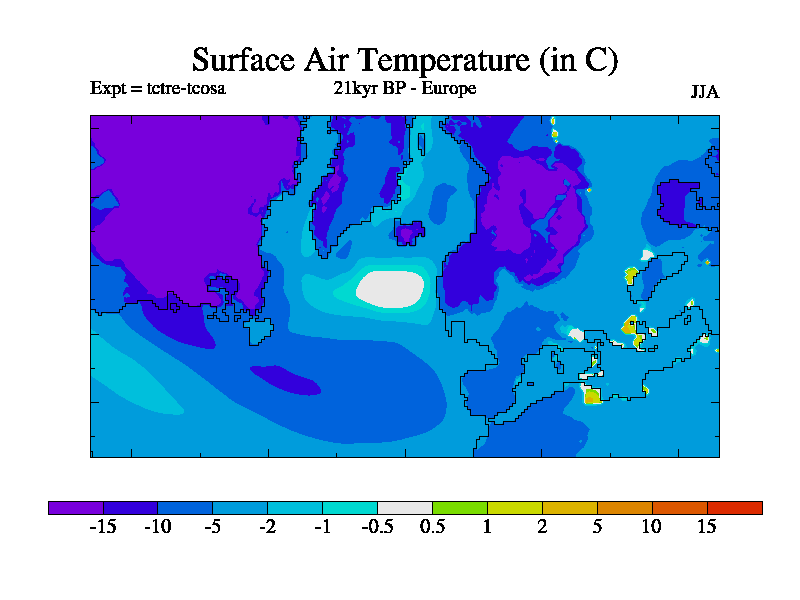
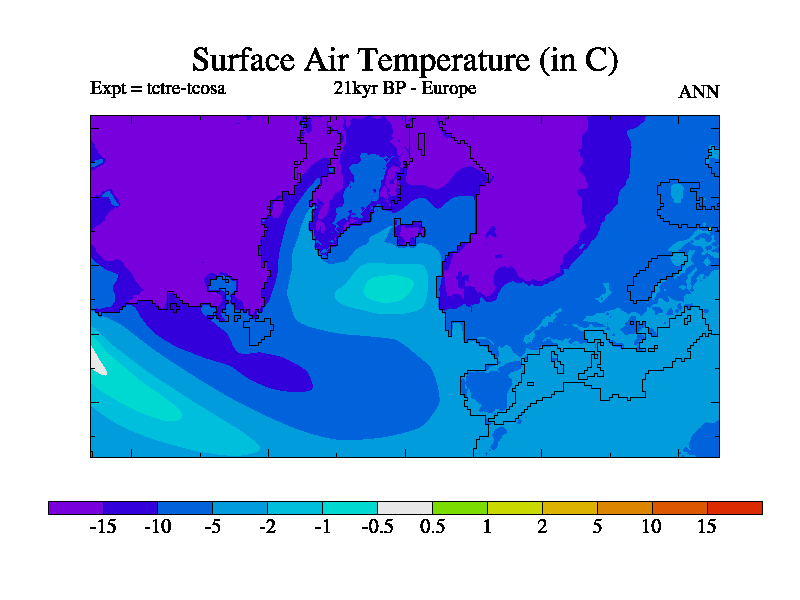
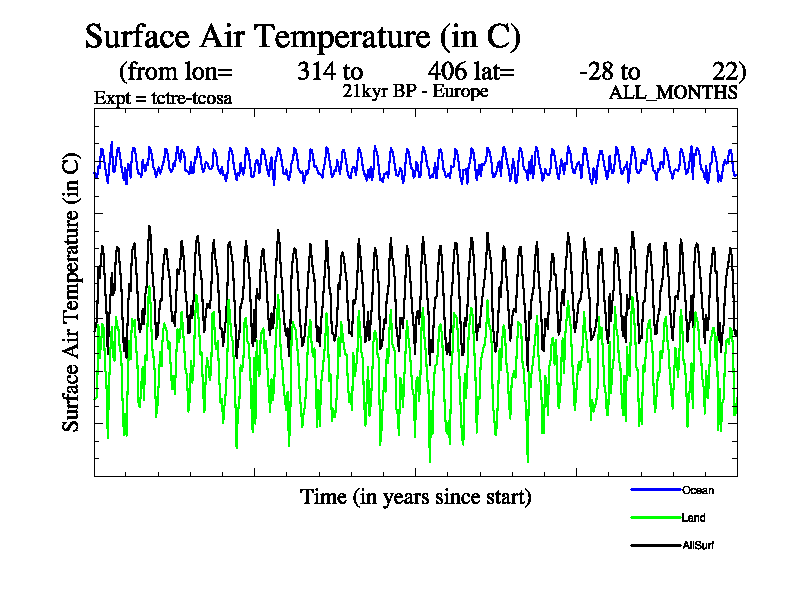
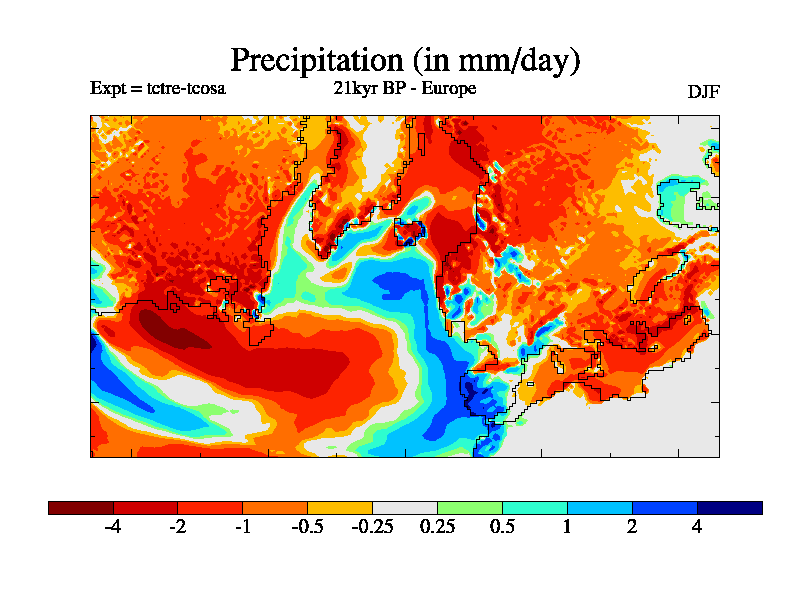
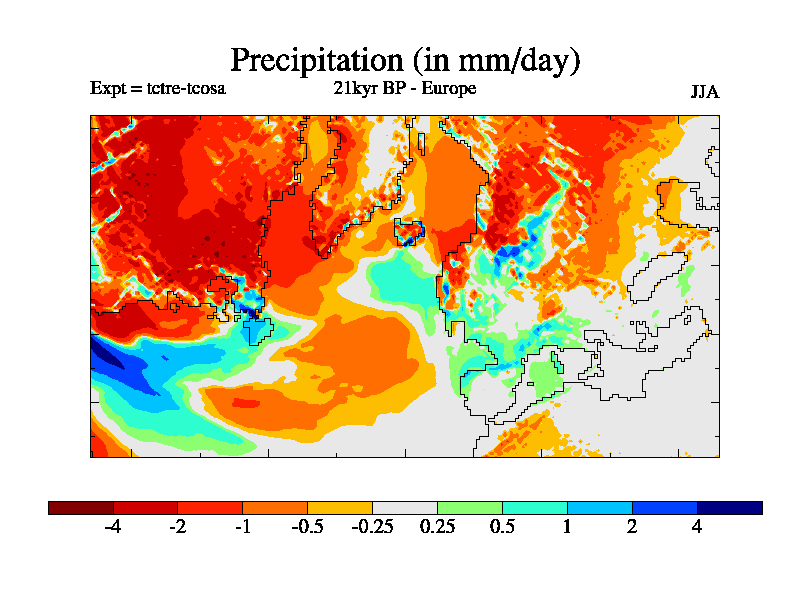
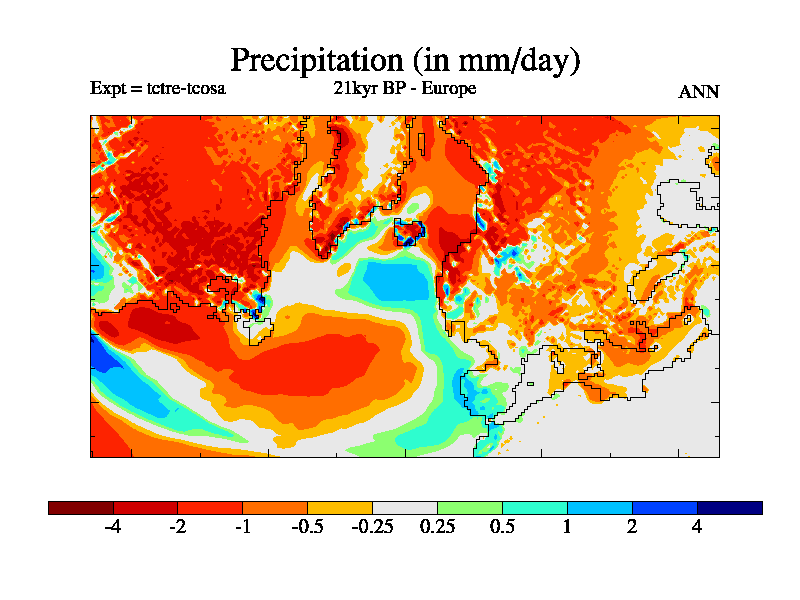
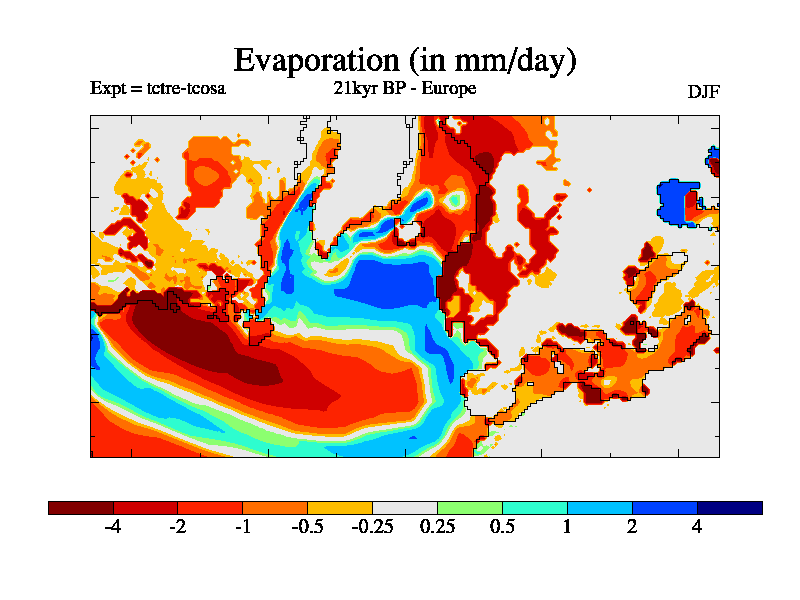
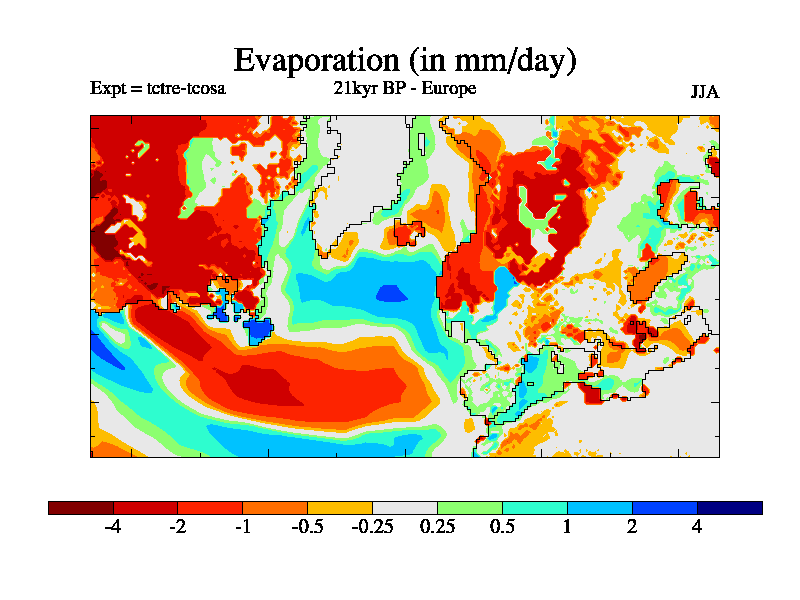
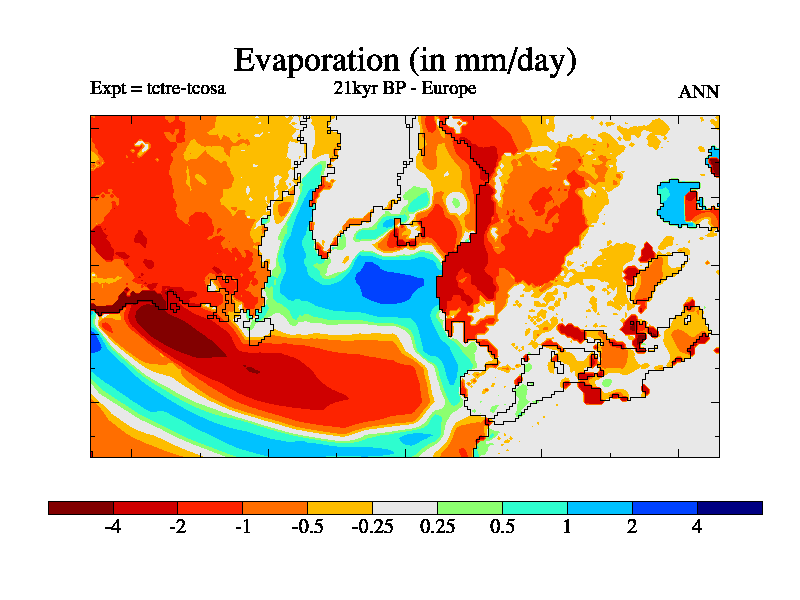
Summary of Results for Experiment tctre-tcosa
Variable
DJF
JJA
ANN
Monthly
Variable
Surface Air Temperature
Surface Air Temperature Time Series
Total Precipitation
Surface Air Temperature Time Series (annual means)
Evaporation
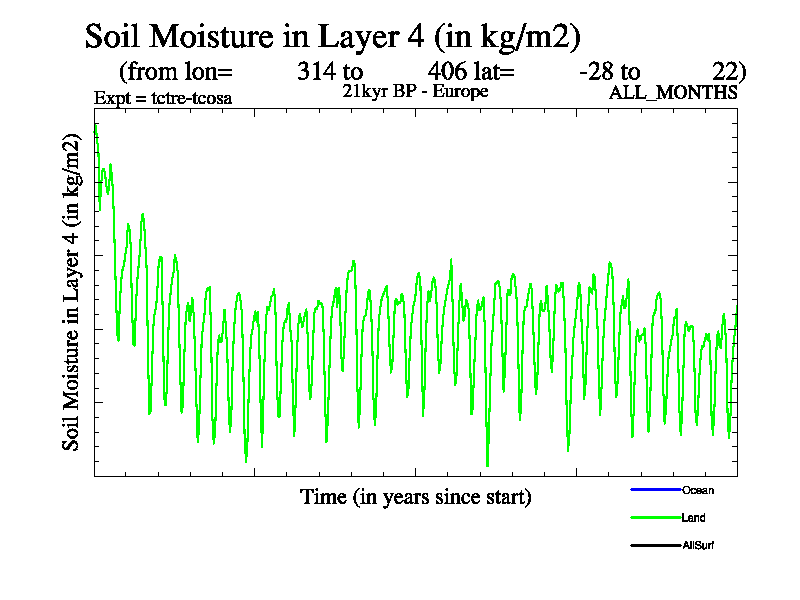
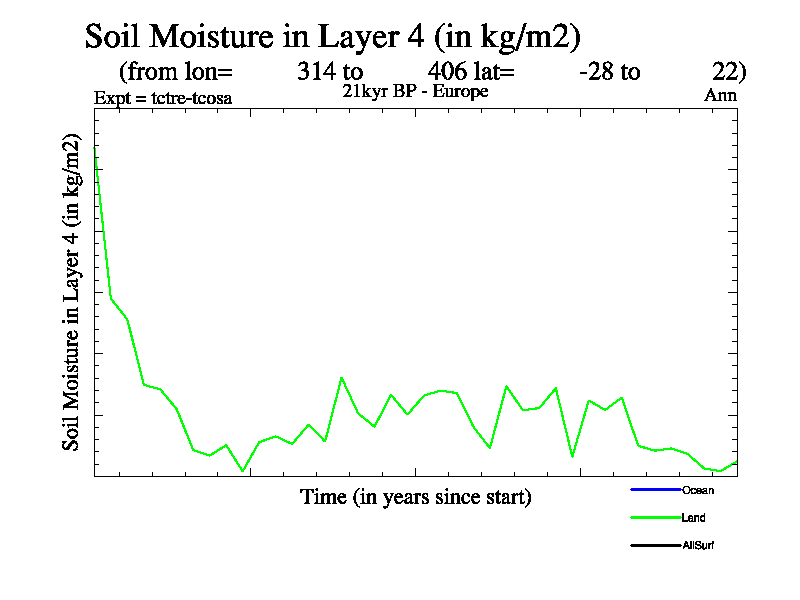
Soil Moisture in Layer 4 (Deepest layer)
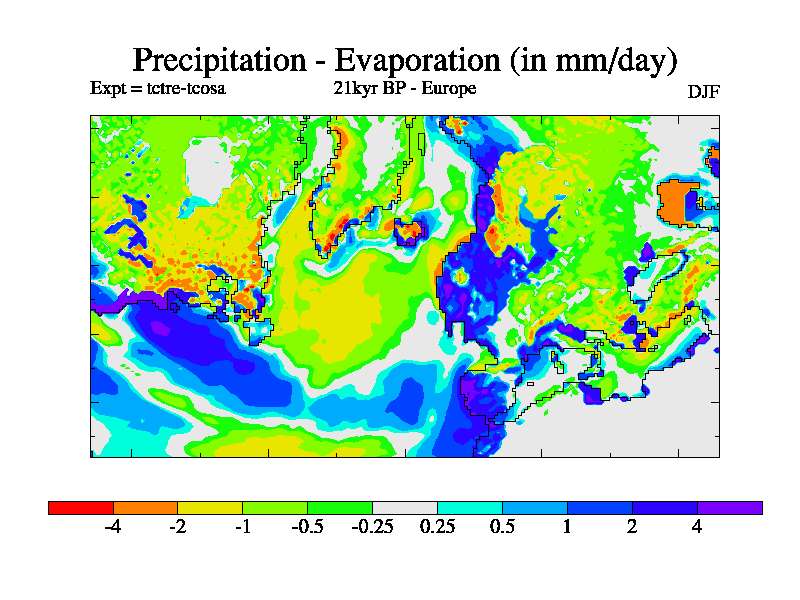
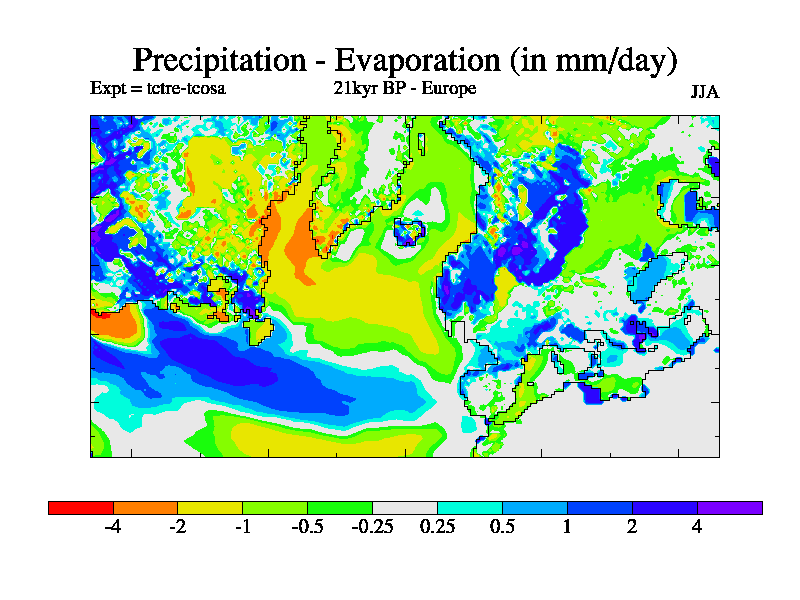
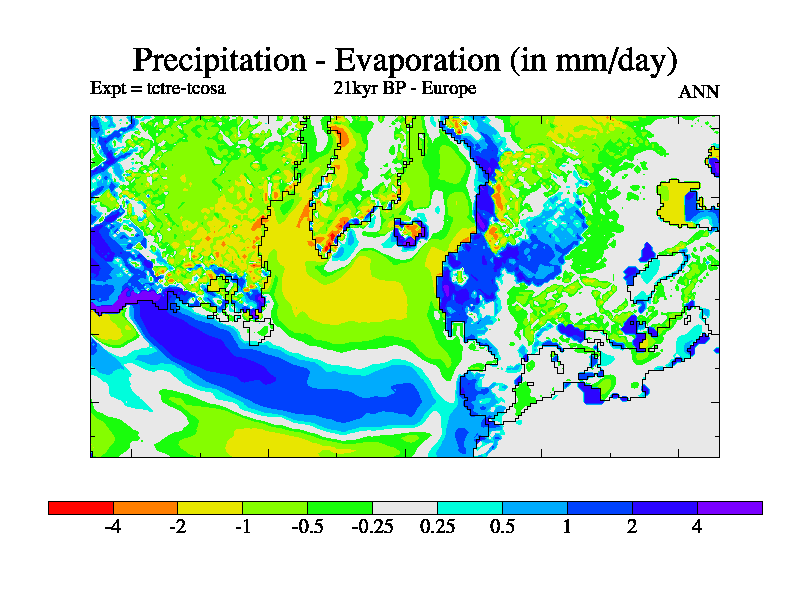
Precipitation - Evaporation
Soil Moisture in Layer 4 (Deepest layer) (annual means)