Bristol Research Initiative for the Dynamic Global
Environment
with the
University of Reading, Open University, and the British Antarctic Survey.
Model Simulations
Experiment: tcqqx
The SSTs and sea-ice from xnjne have been re-done ot more closely match the original fields in tcqqg, but with the corrected sea-ice depth, which is incorrect in tcqqg.
Brief Description
Fuller Description
Total Length of Run (in years)
Averaging period (in years)
Spinup period (in years)
CO2 (in ppmv)
CH4 (in ppbv)
N2O (in ppbv)
CFC11 (in pptv)
CFC12 (in pptv)
Computer used for simulation
Compiler used for simulation
Date of first entry in datebase
Date of most recent modification to entry in database
HadAM3H_tcmfa_sst
This is a copy of the new benchmark HadAM3HM1 job (tdedc), but with the spectral file modified as in tcqqg, and the primary field advection is 1C not 1E. This is using a 19 level version of HadAM3 and is identical to xnjnf except for this.
60
15
45
280
760
270
0
0
bc4
Intel_v17_0.1_bc4
2019_07_08_13_24
2019_07_08_13_24
You can access the means from this run, by going here
This page shows a small subset of images from this simulation. They have
already been produced and there are no optional choices. If you want to do a
more detailed examination of the model results, you can go to the
main page and select one of the Parts. This will give you full access the system
Summary of Results for Experiment tcqqx
Variable
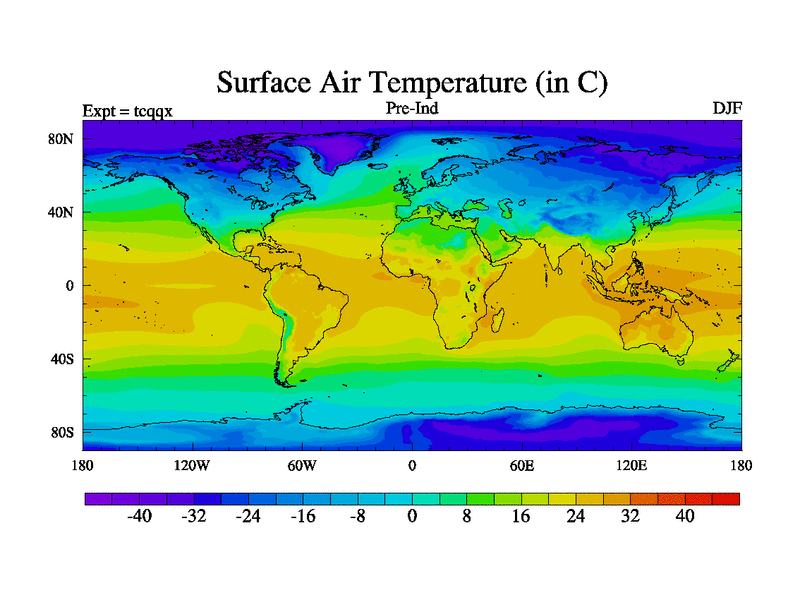
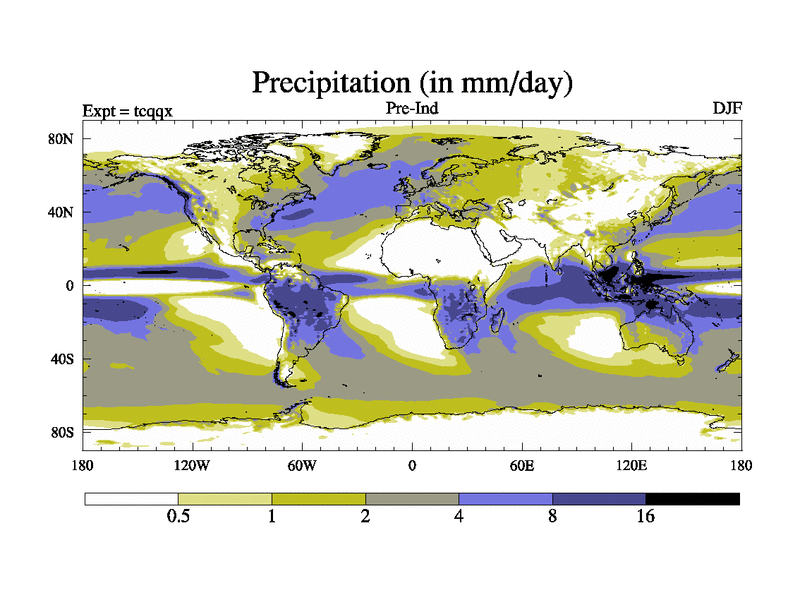
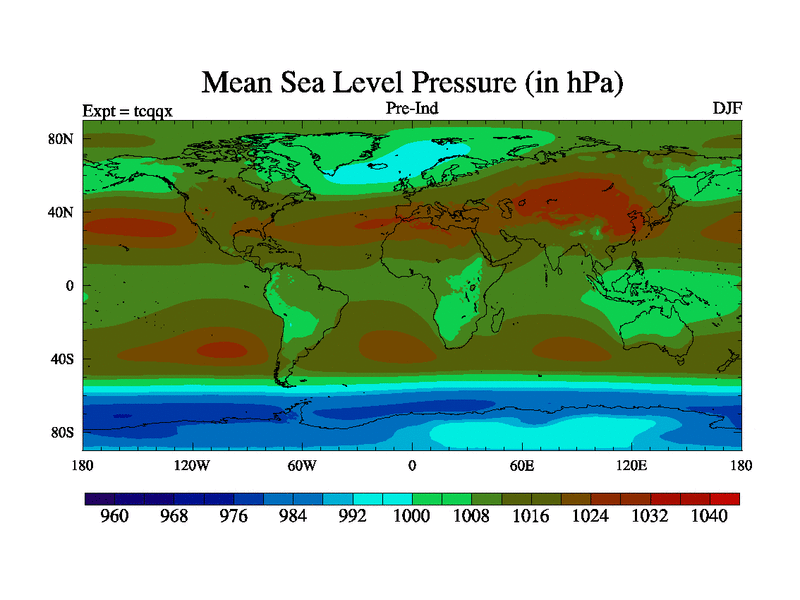
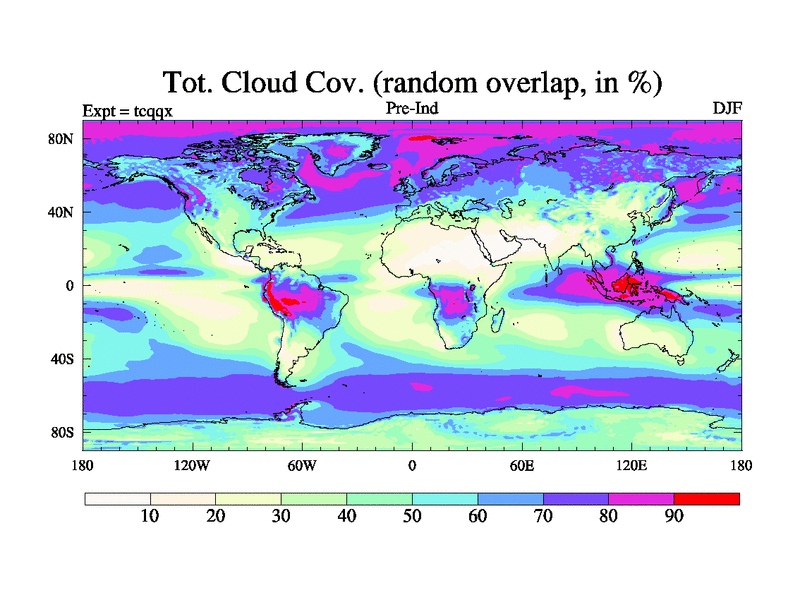
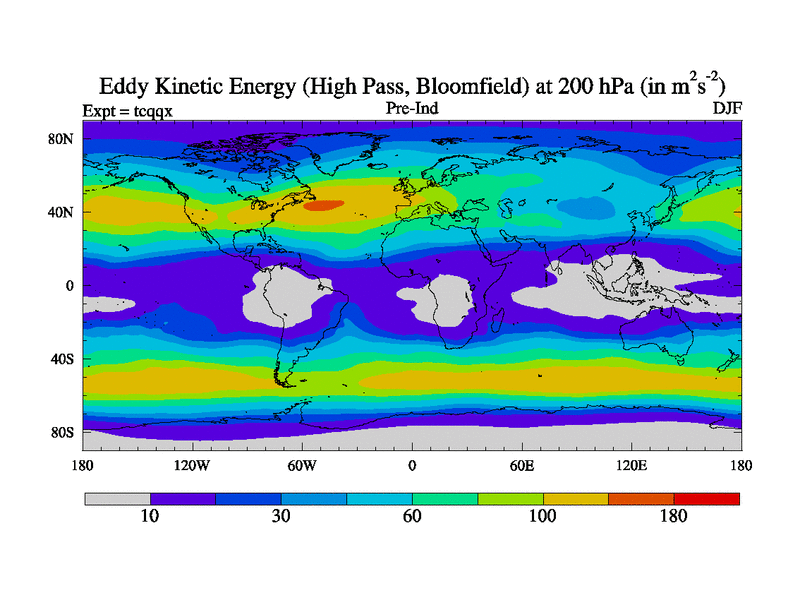
DJF
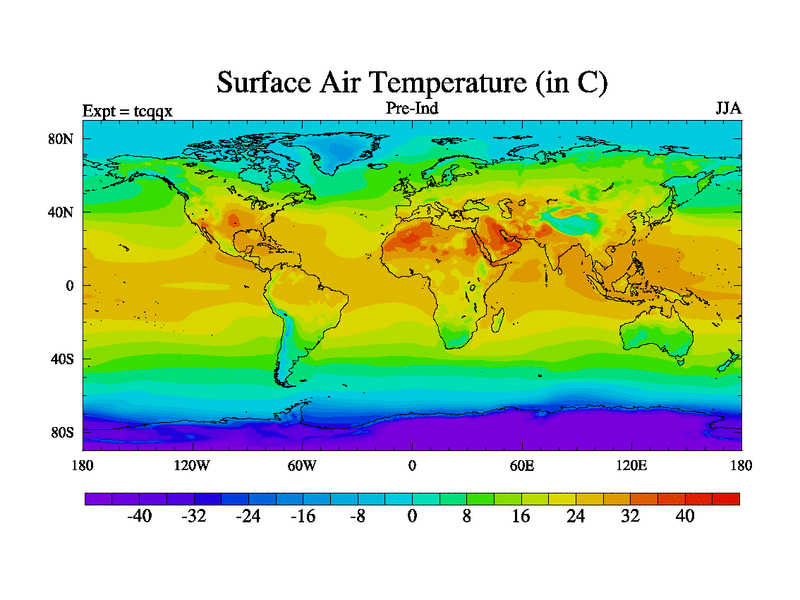
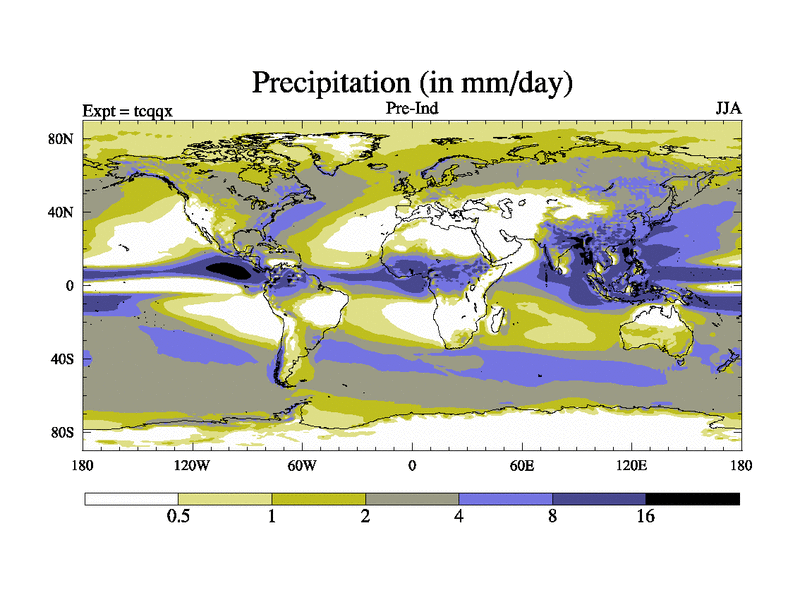
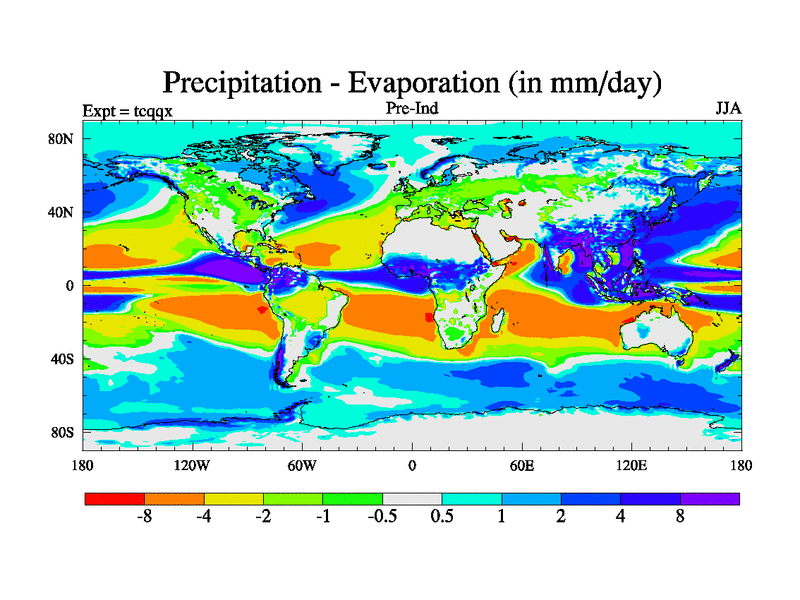
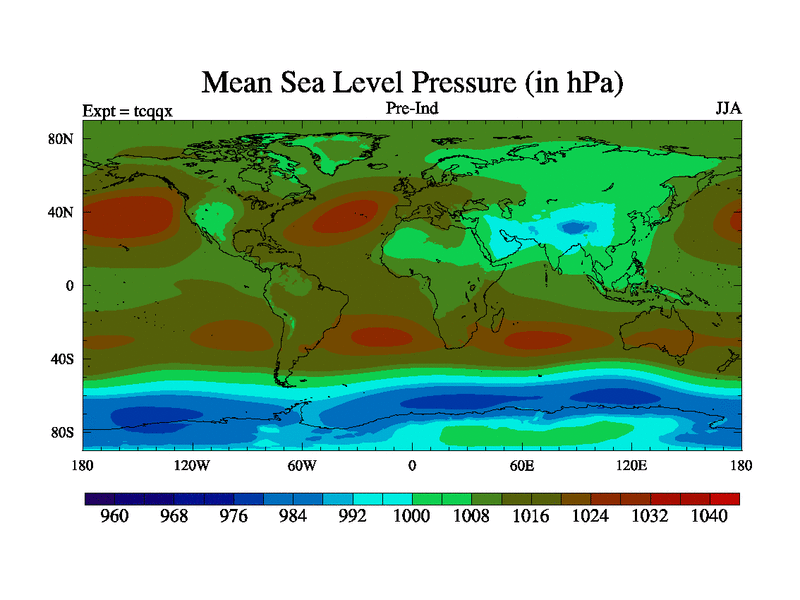
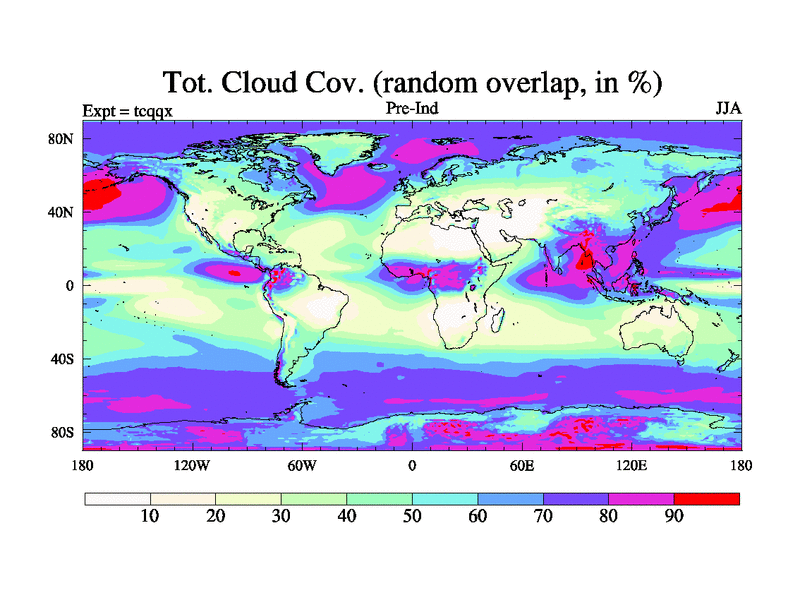
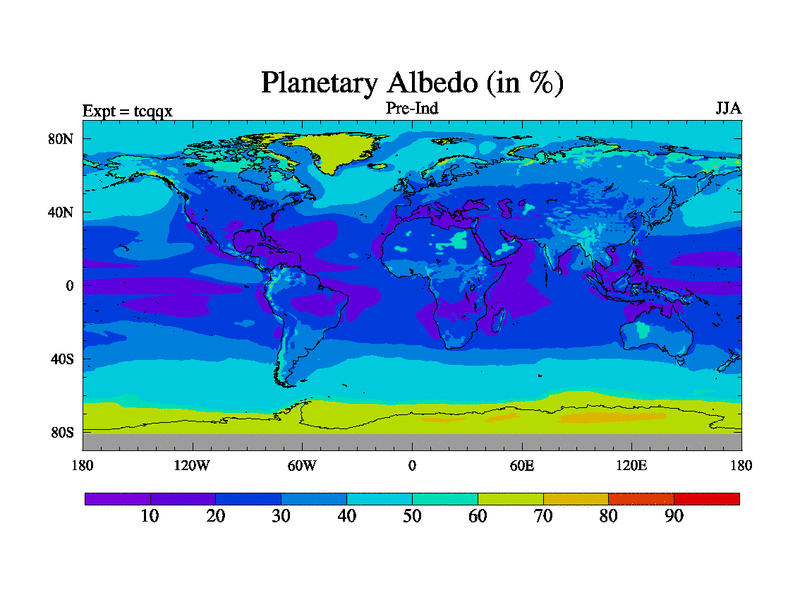
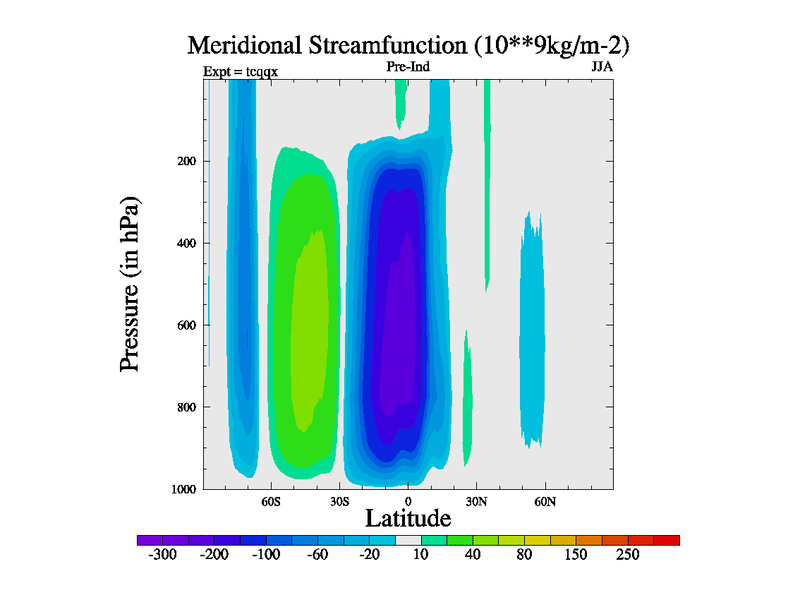
JJA
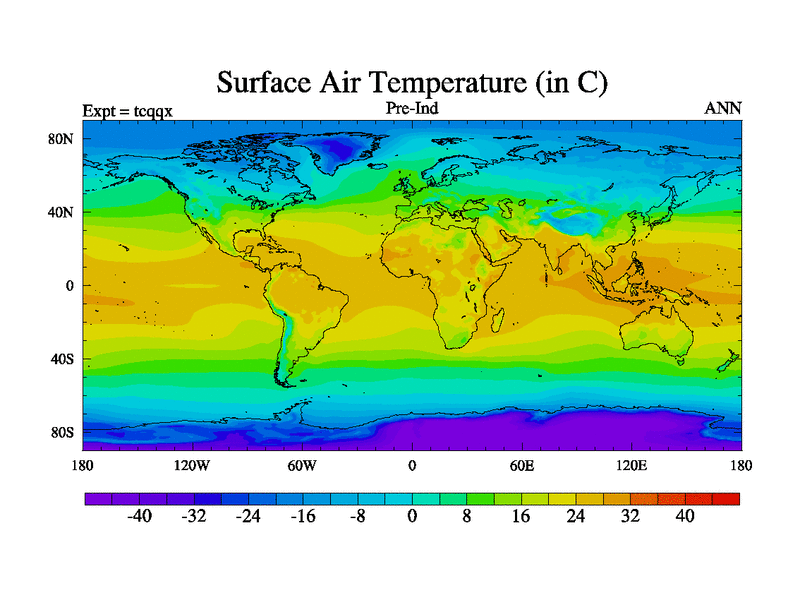
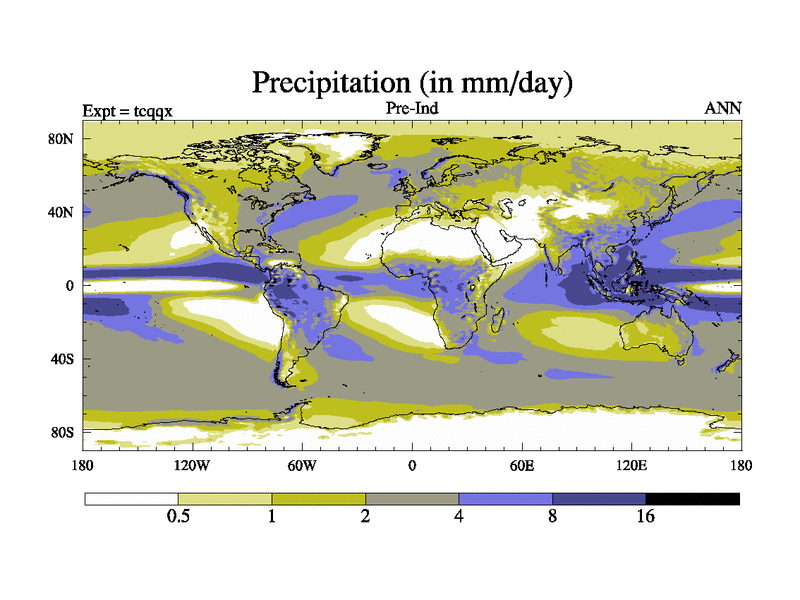
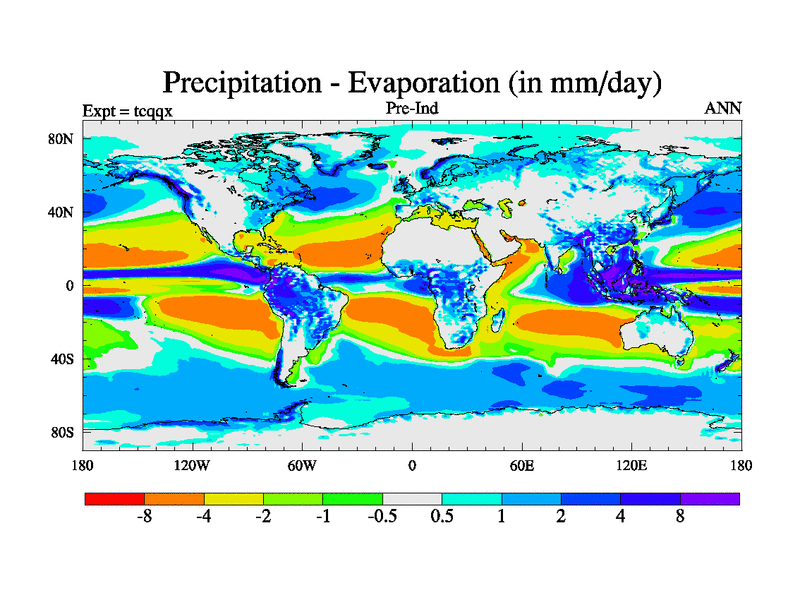
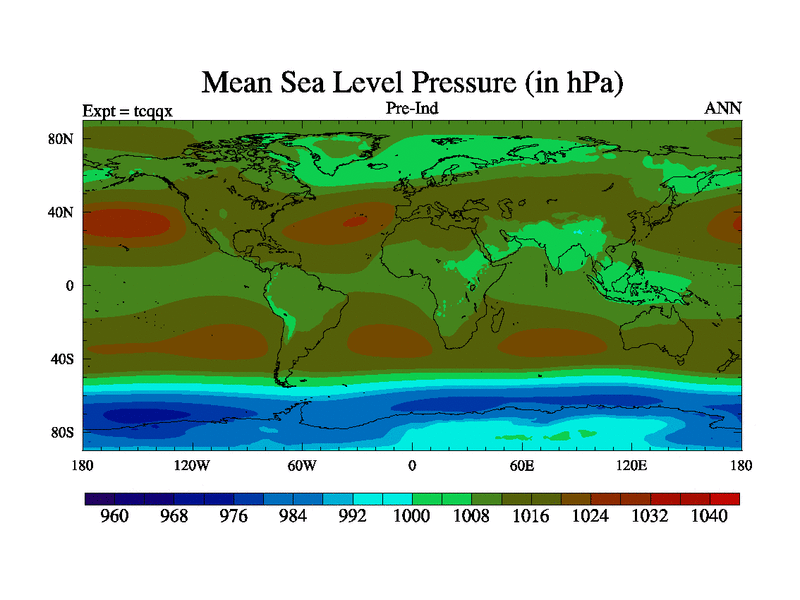
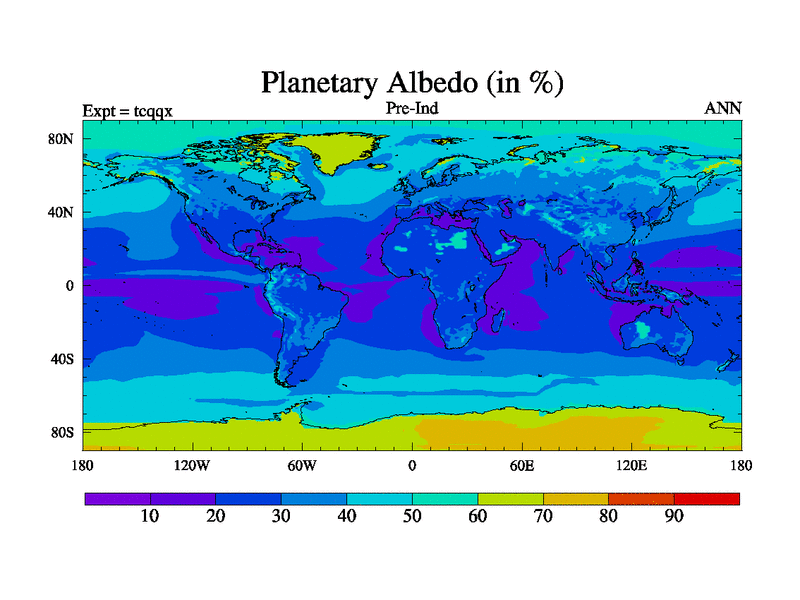
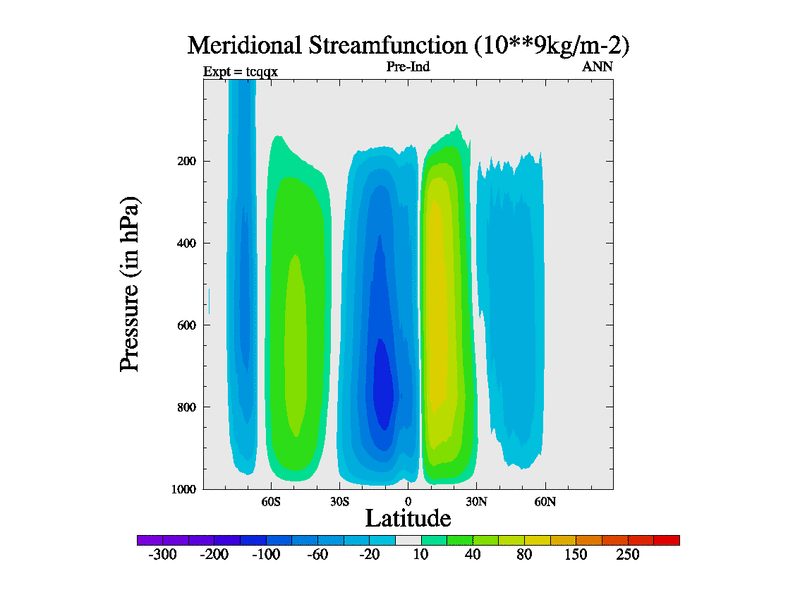
ANN
Monthly
Variable
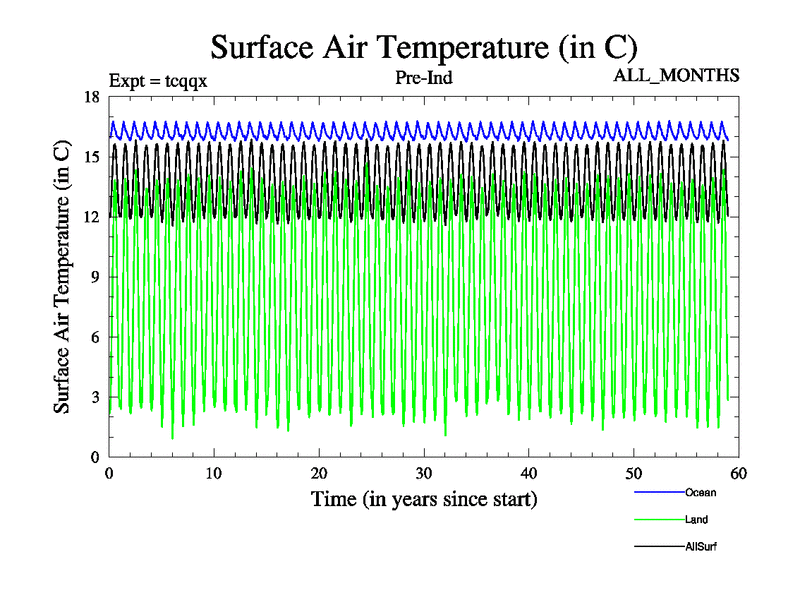
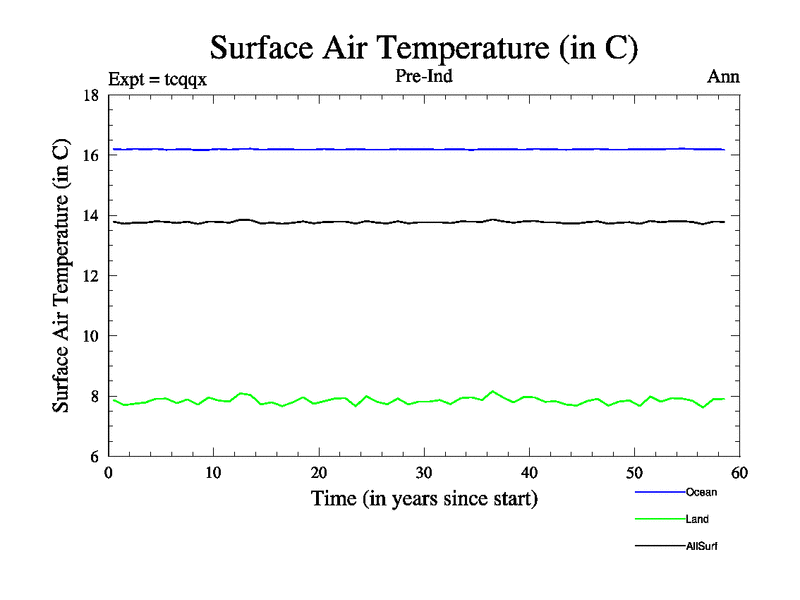
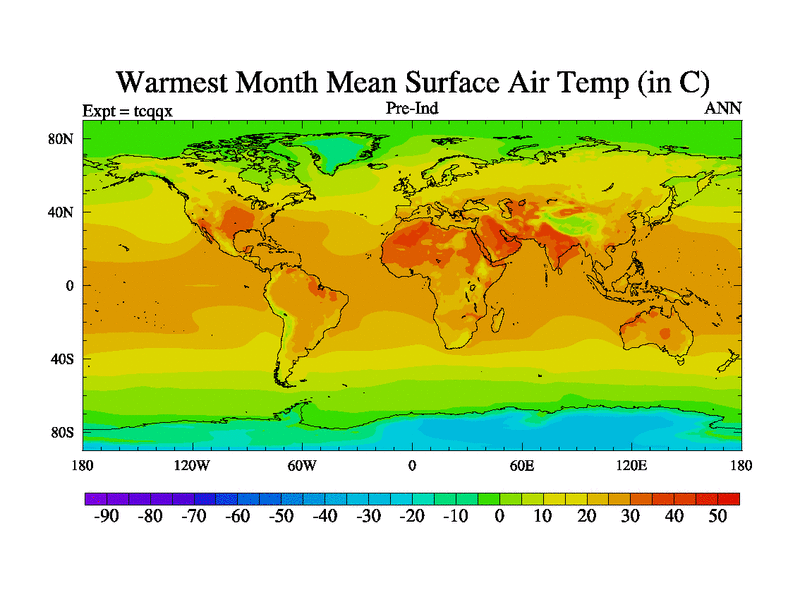
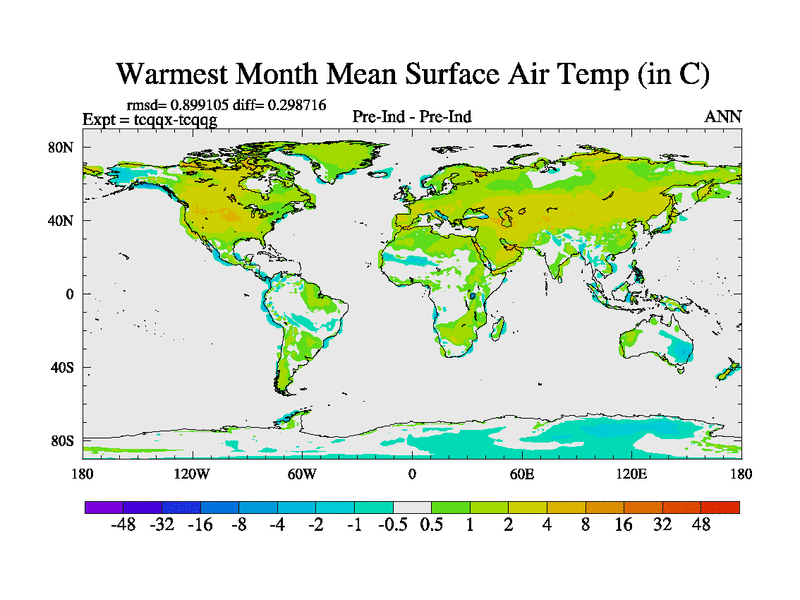
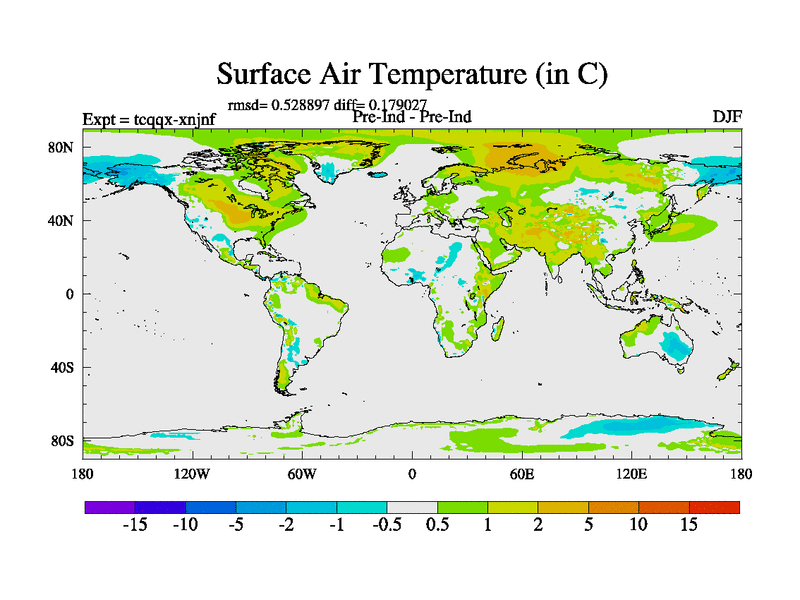
Surface Air Temperature
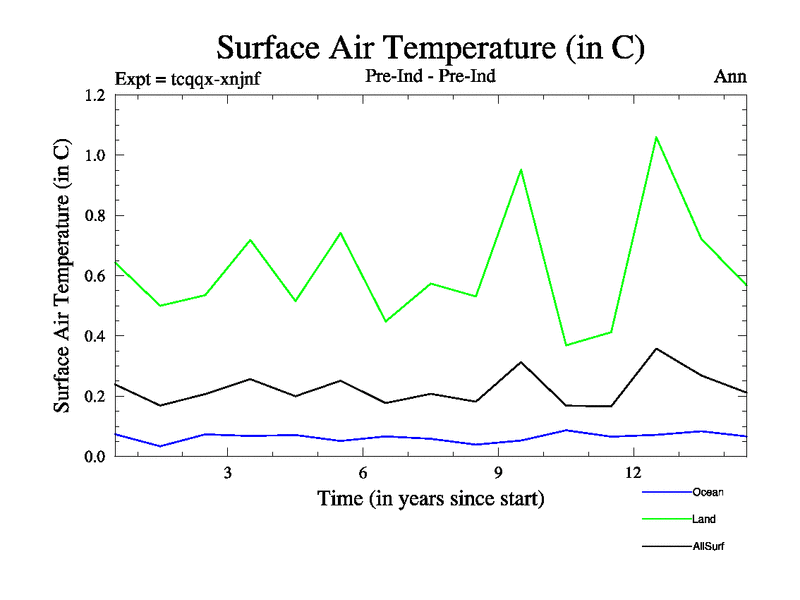
Surface Air Temperature Time Series
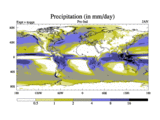
Total Precipitation
Surface Air Temperature Time Series (annual means)
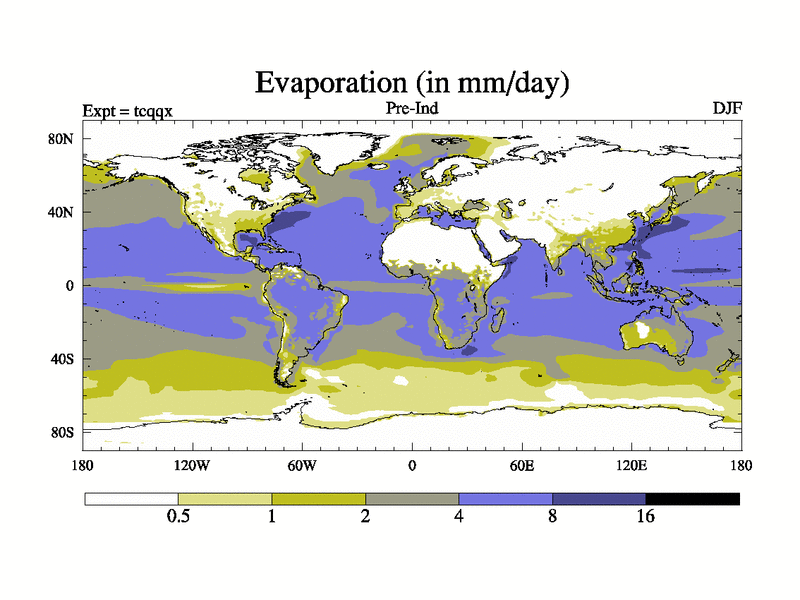
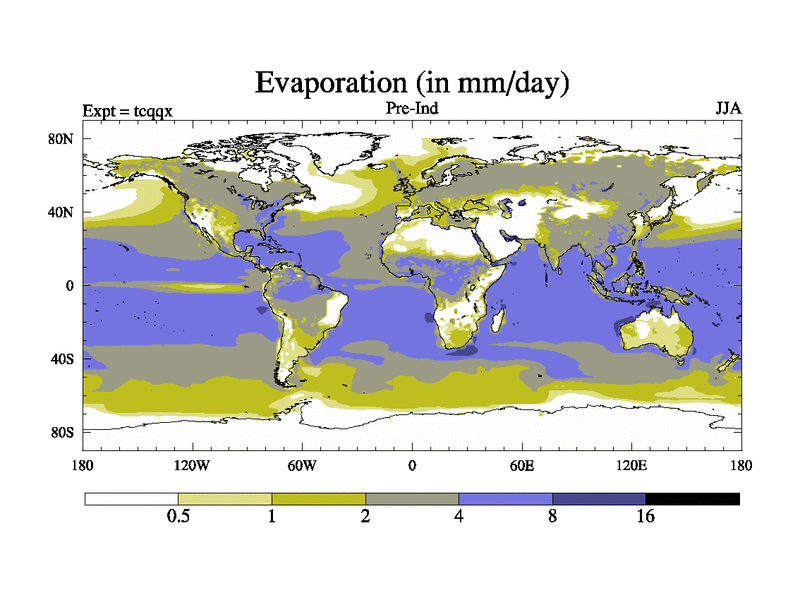
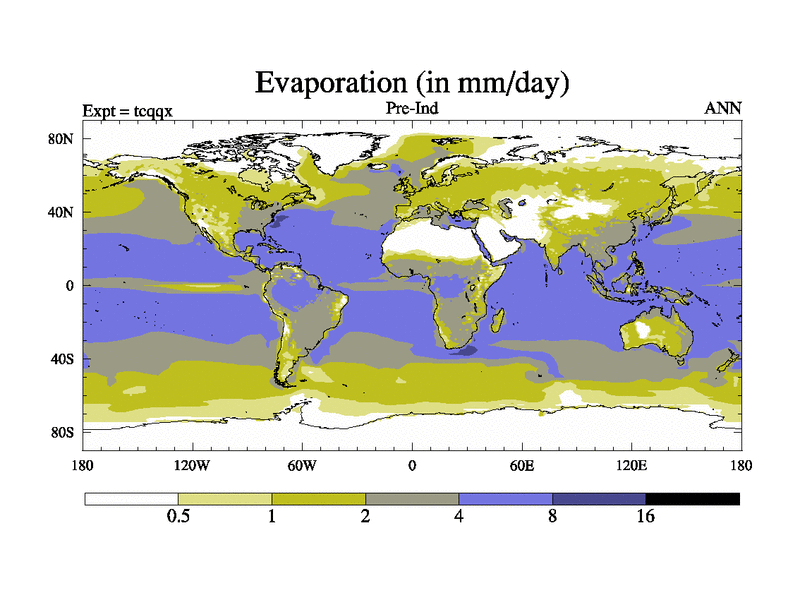
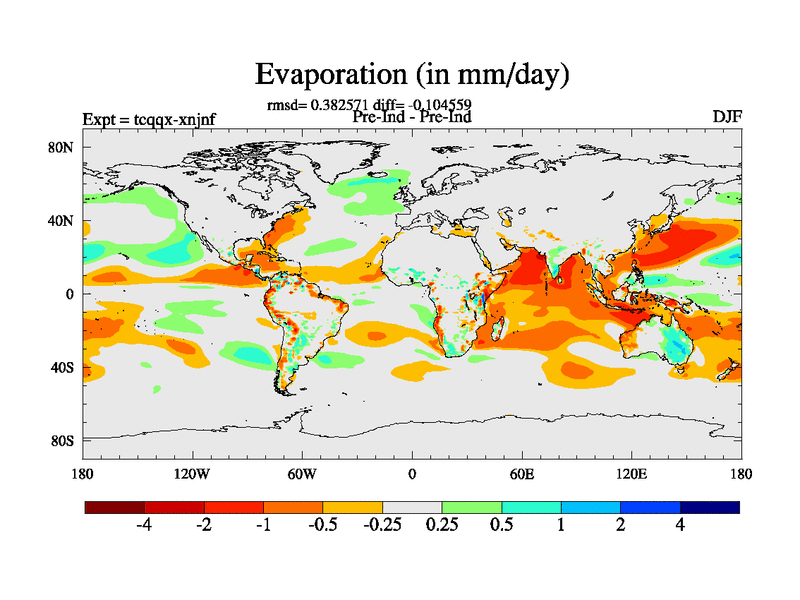
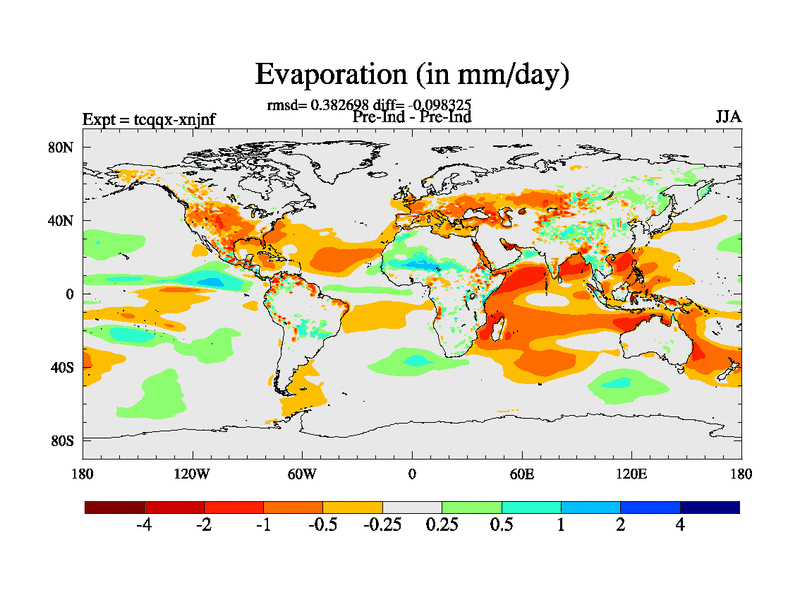
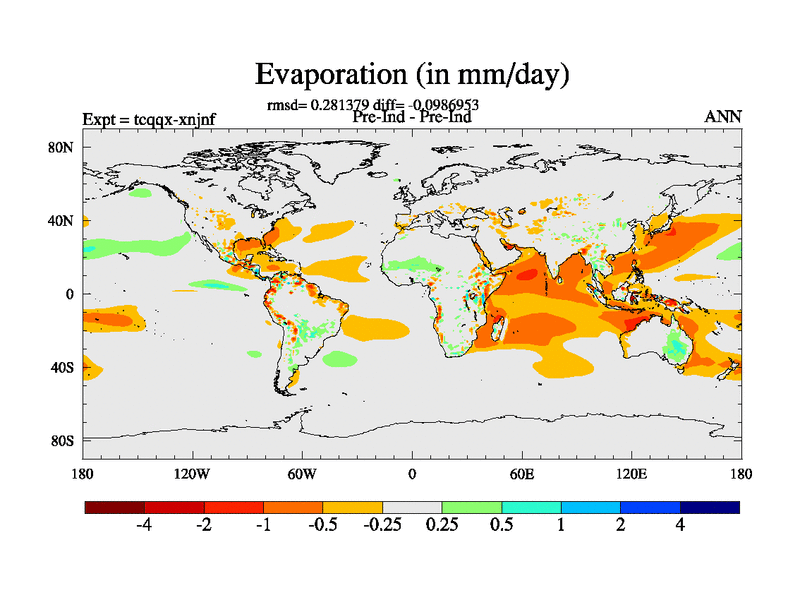
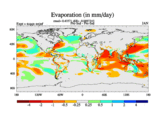
Evaporation
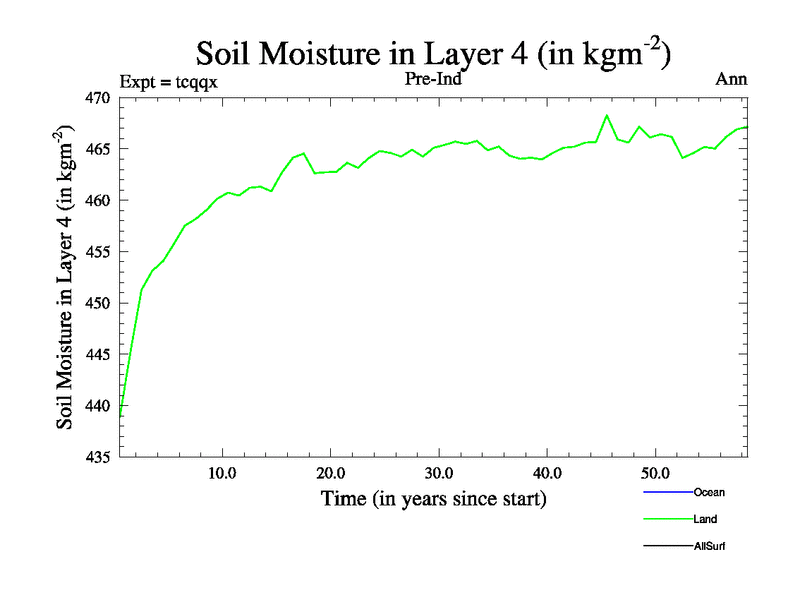
Soil Moisture in Layer 4 (Deepest layer) (annual means)
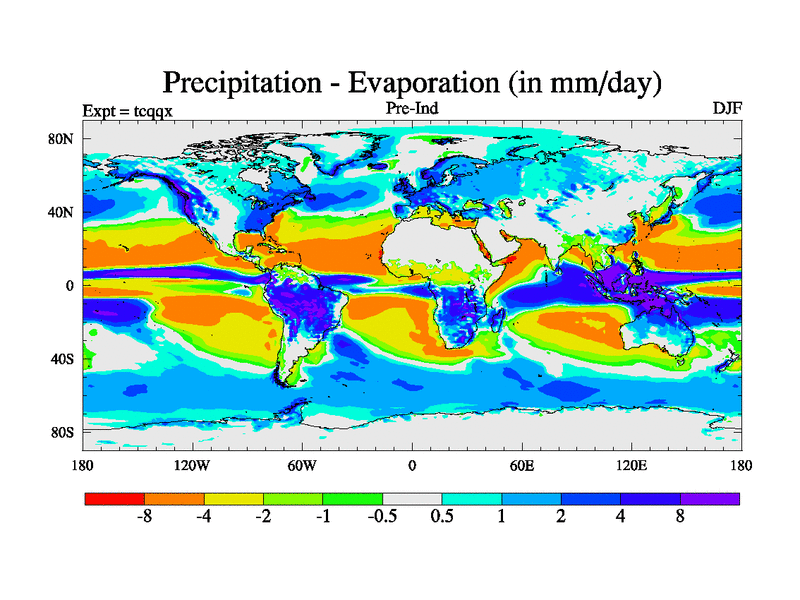
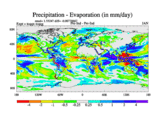
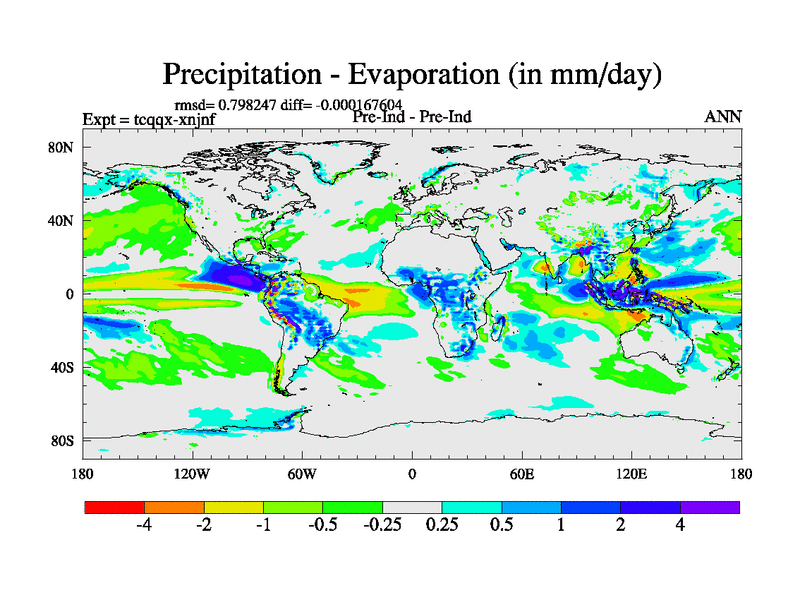
Precipitation - Evaporation
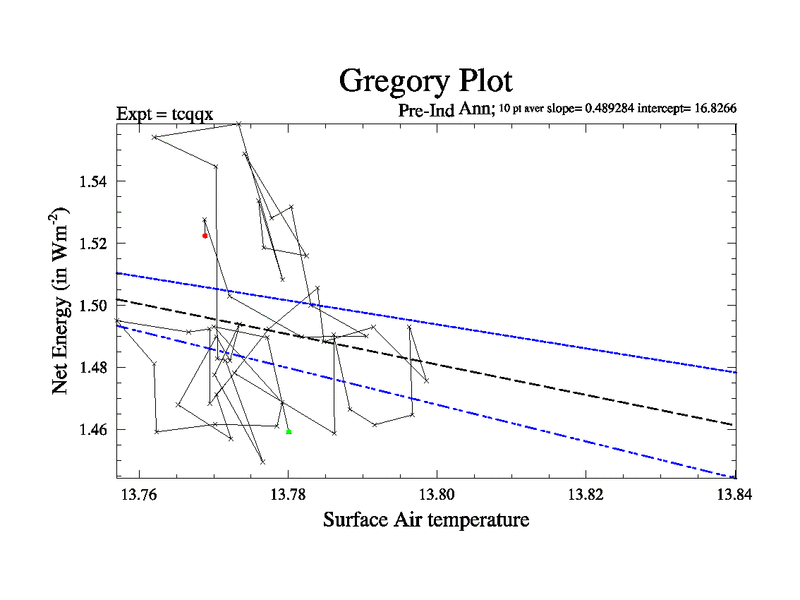
Gregory Plot (10 year running mean)
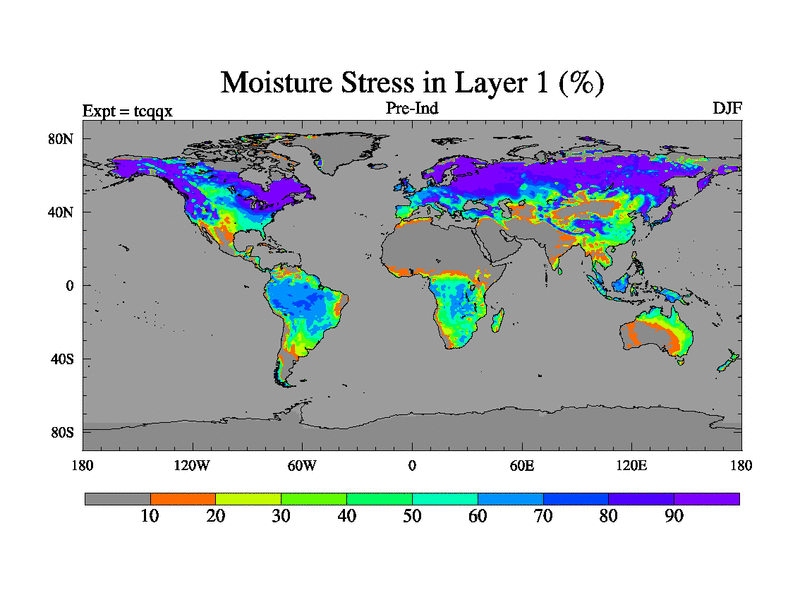
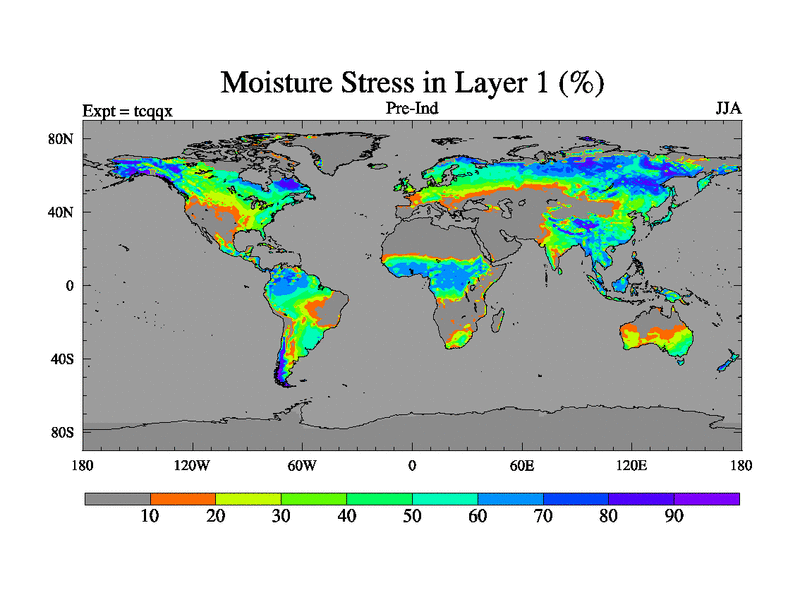
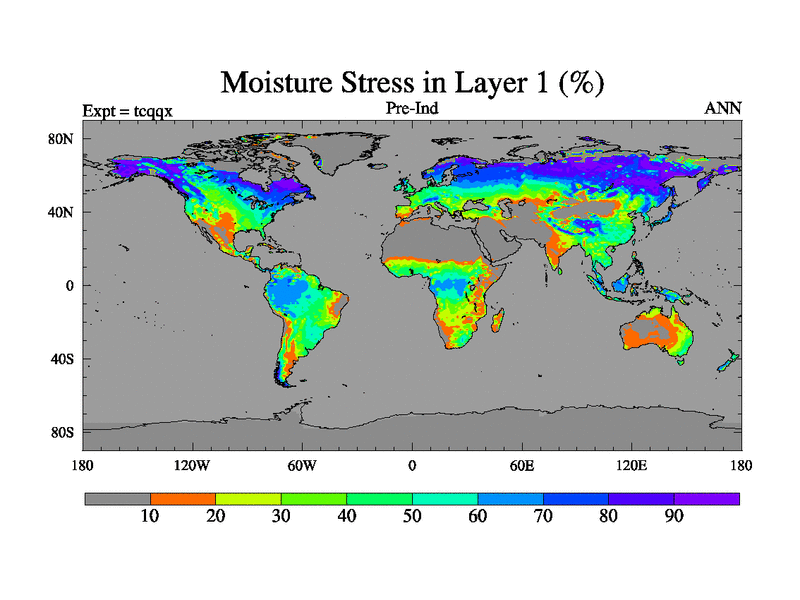
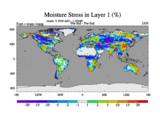
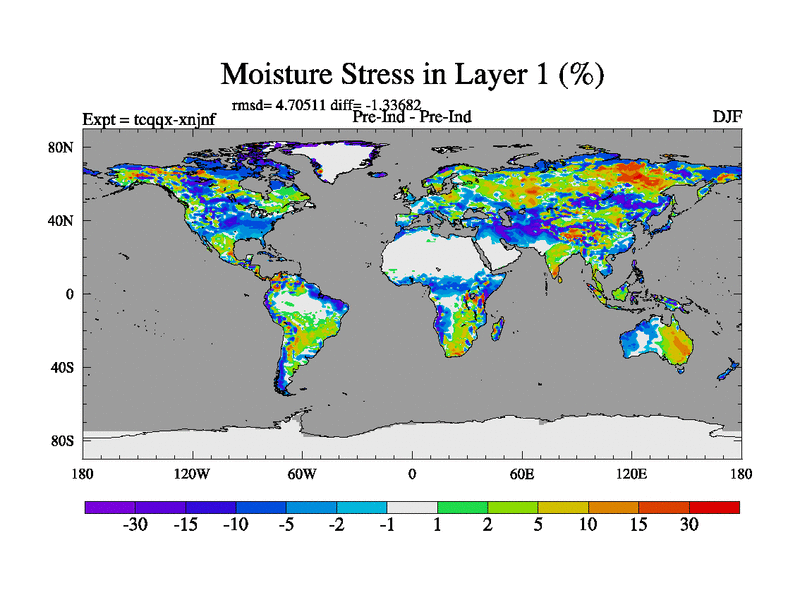
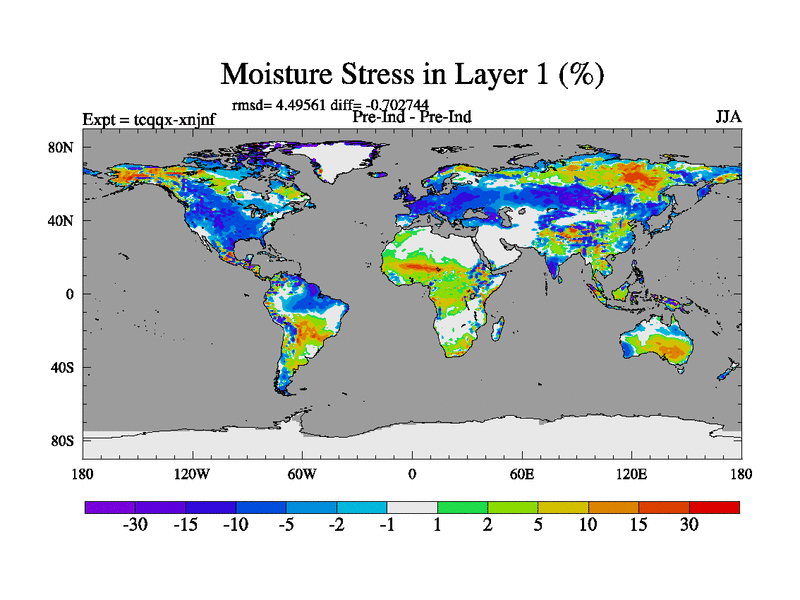
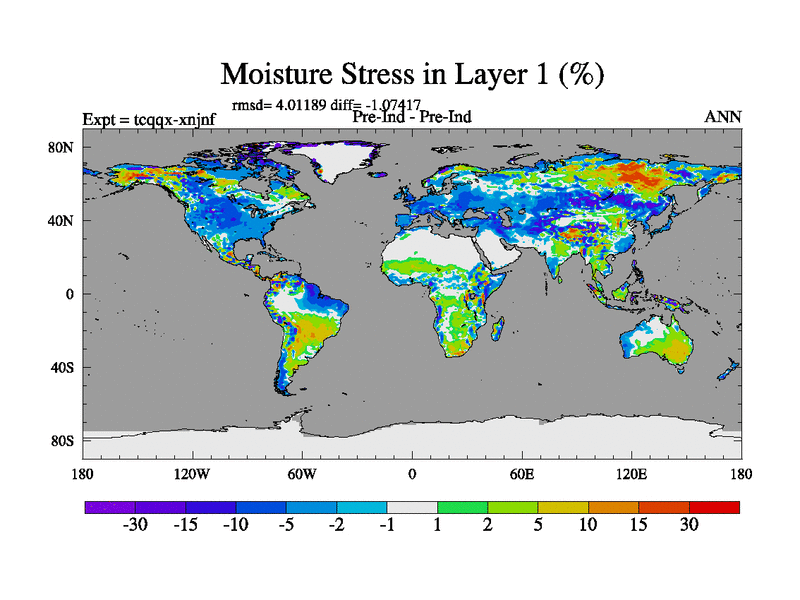
Fractional Plant Stress (layer 1)
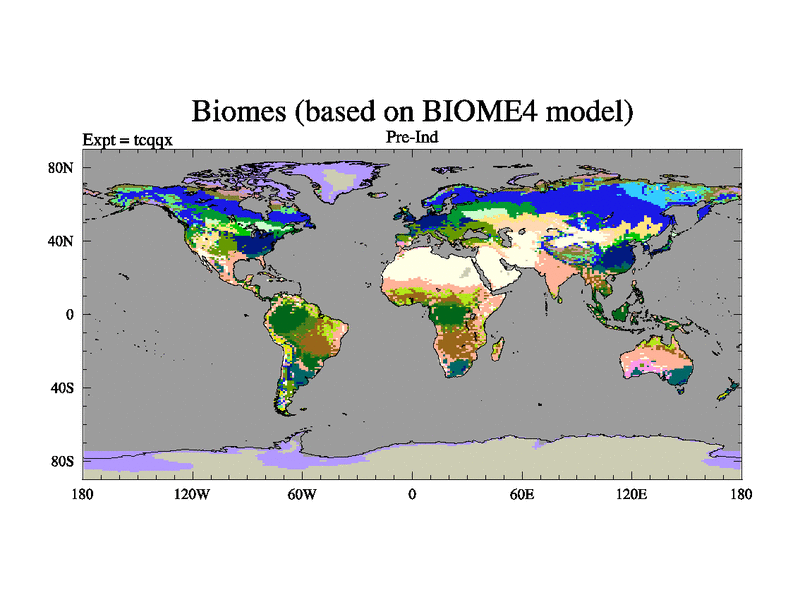
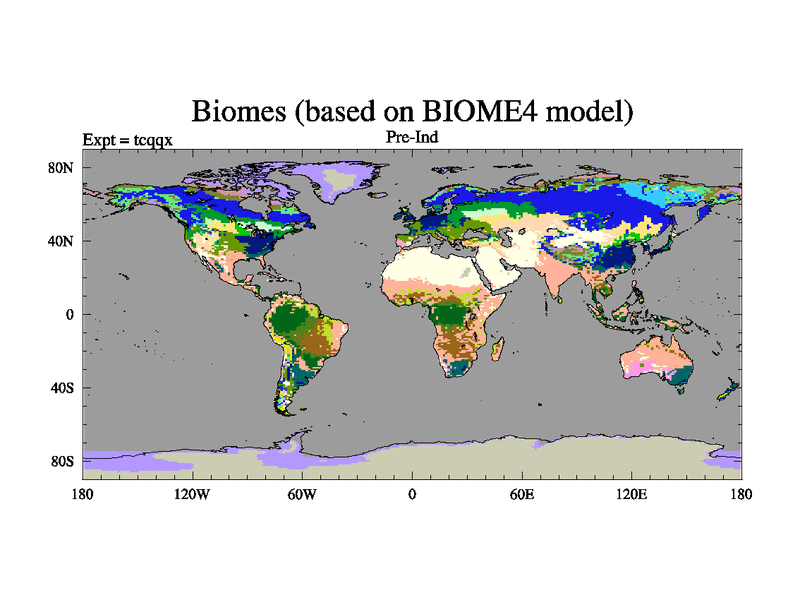
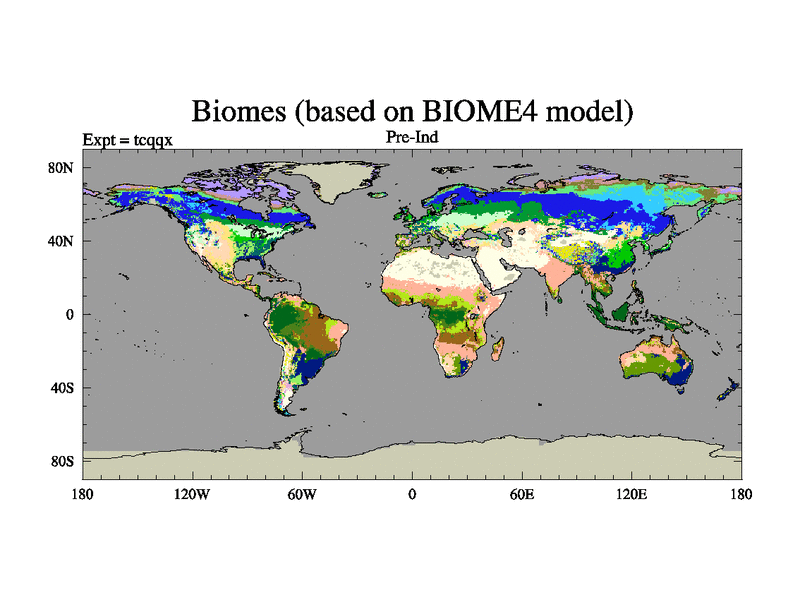
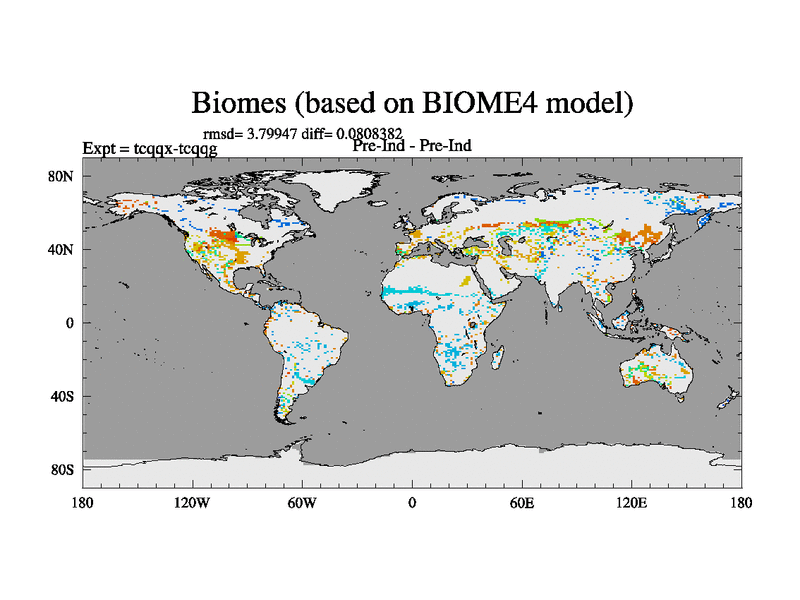
BIOME4
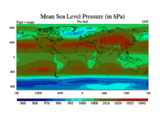
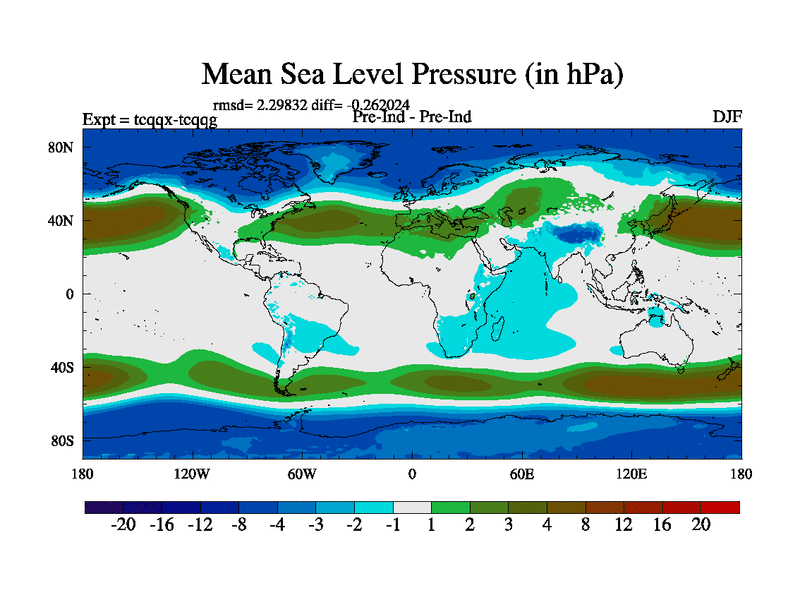
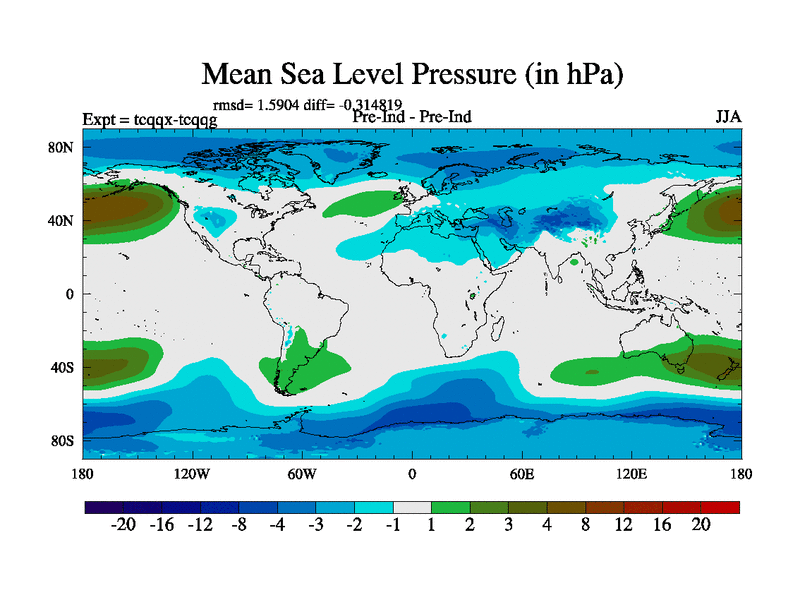
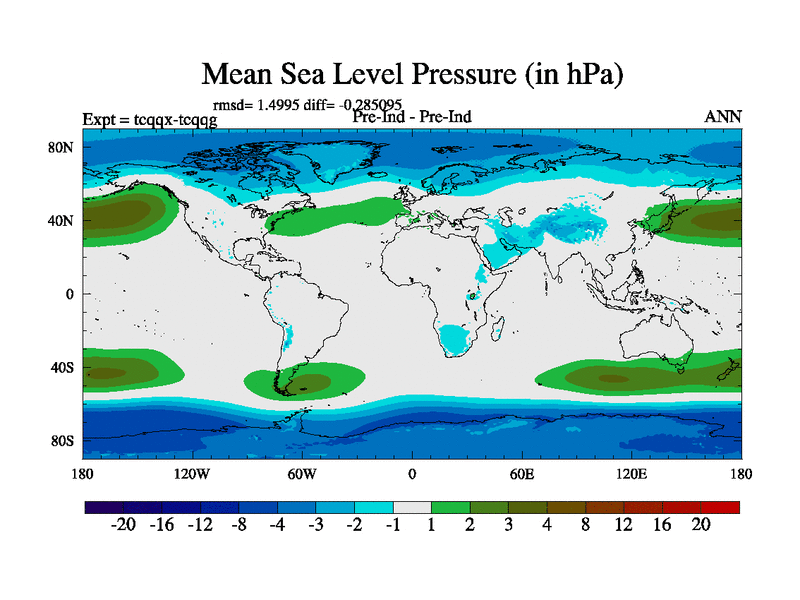
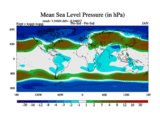
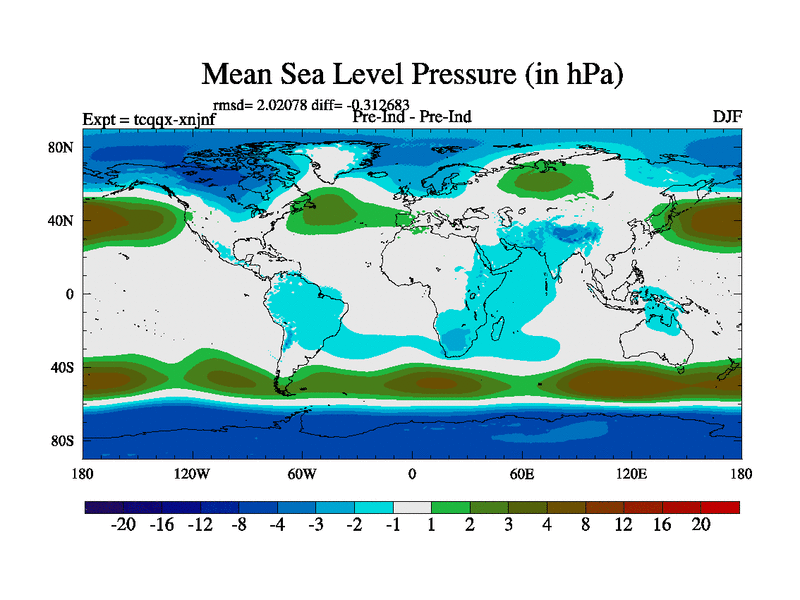
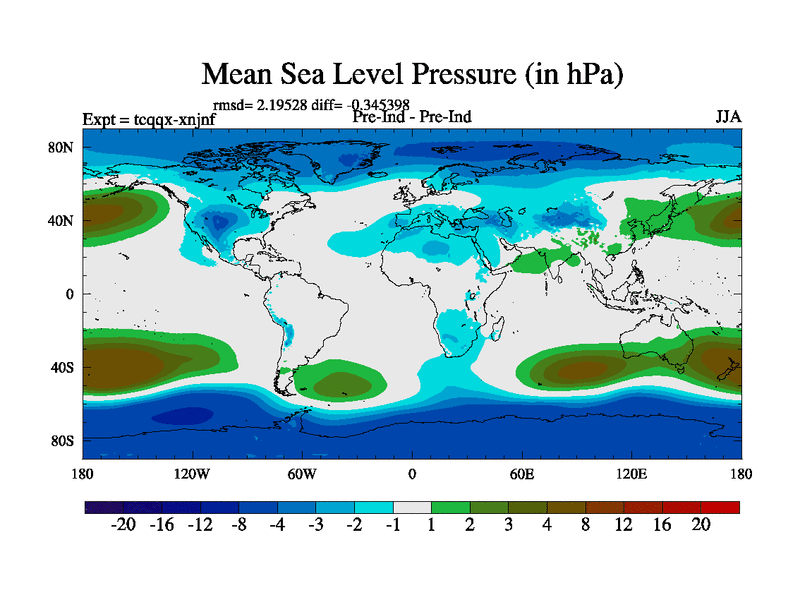
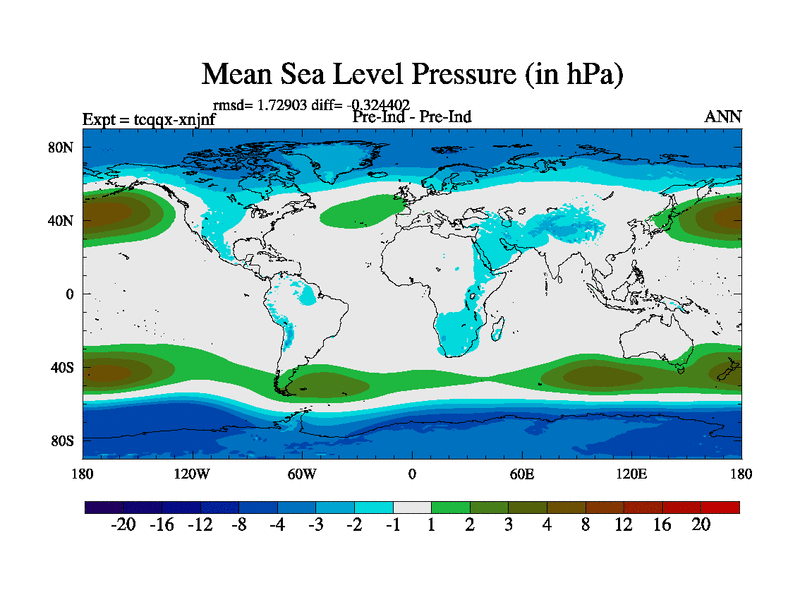
Mean Sea Level Pressure
BIOME4 with CO2 changed
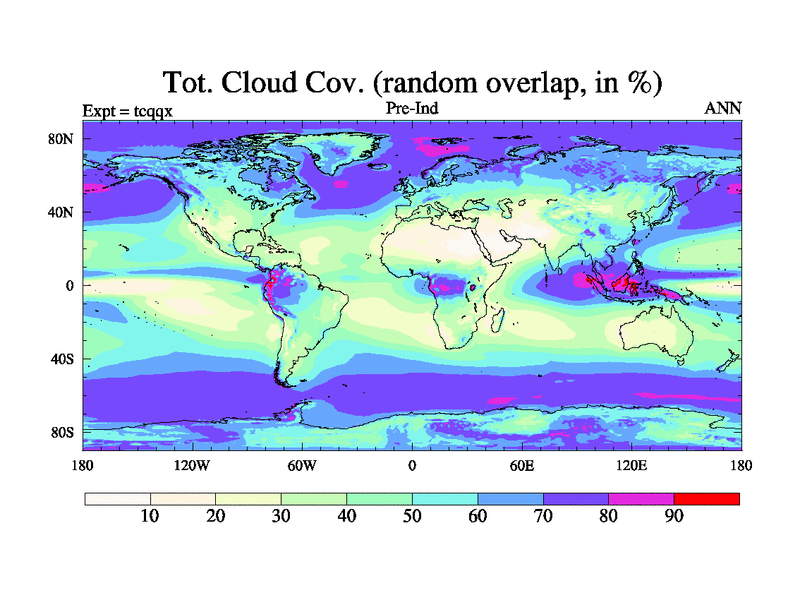
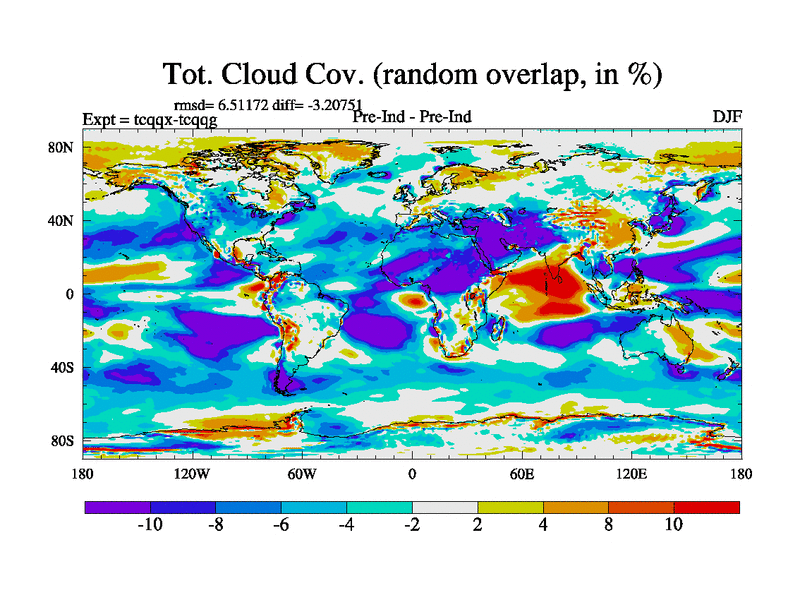
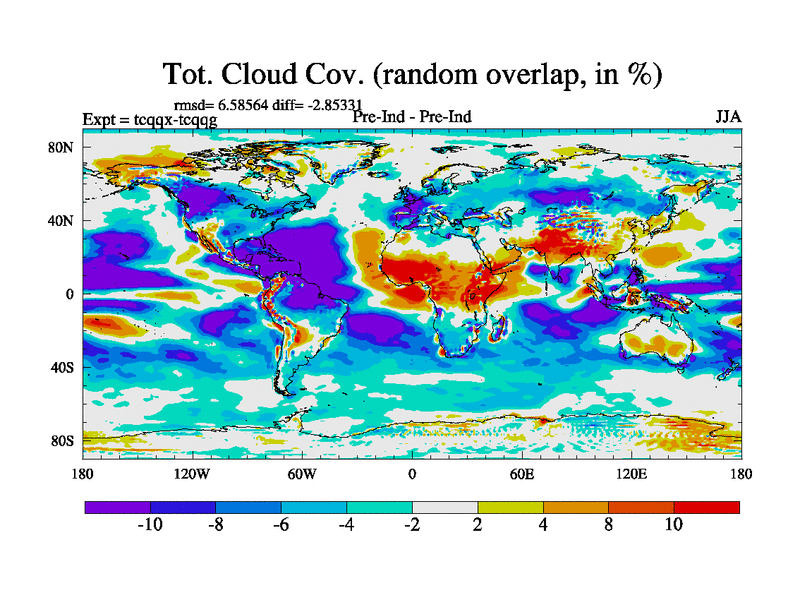
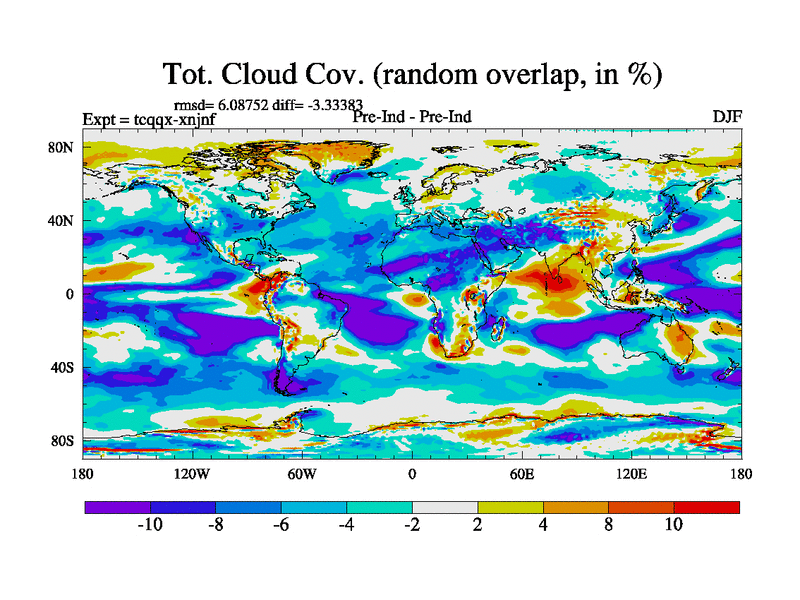
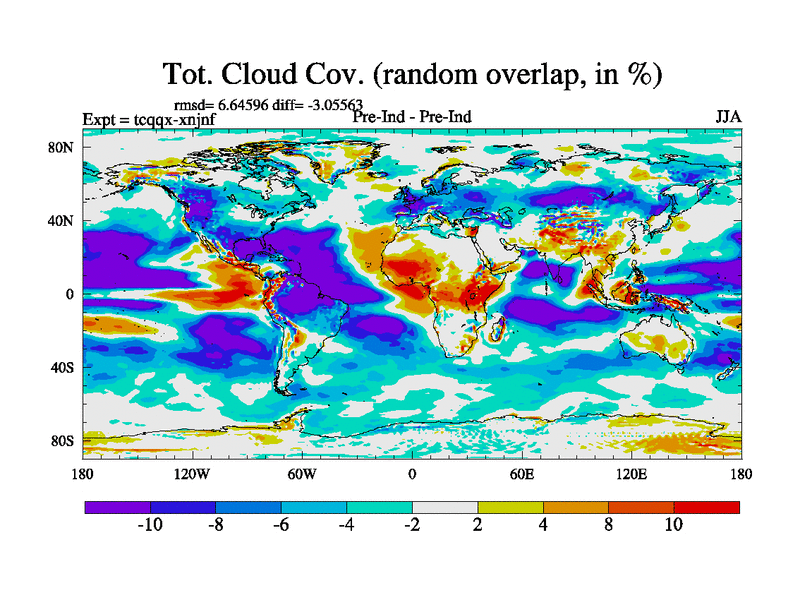
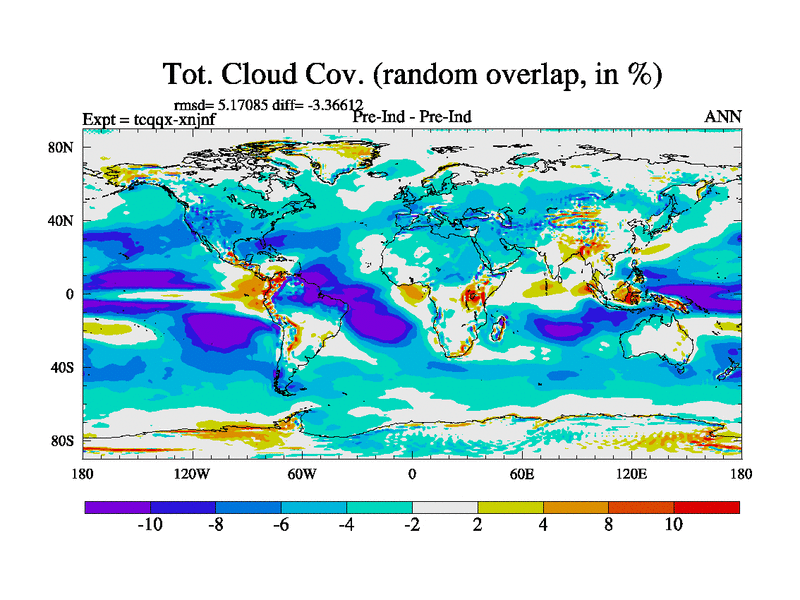
Total Cloud Cover
BIOME4 with CO2 changed and anomaly of climate
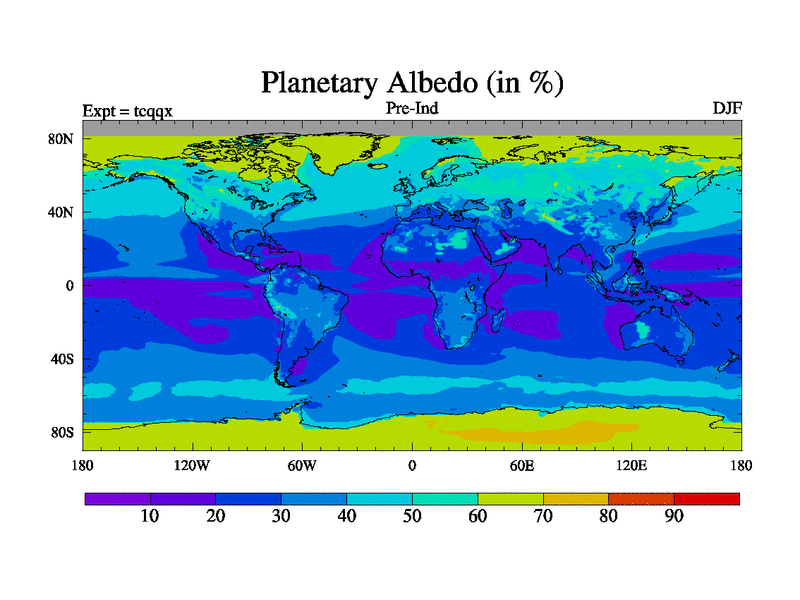
Plantary Albedo
Warm Month Mean
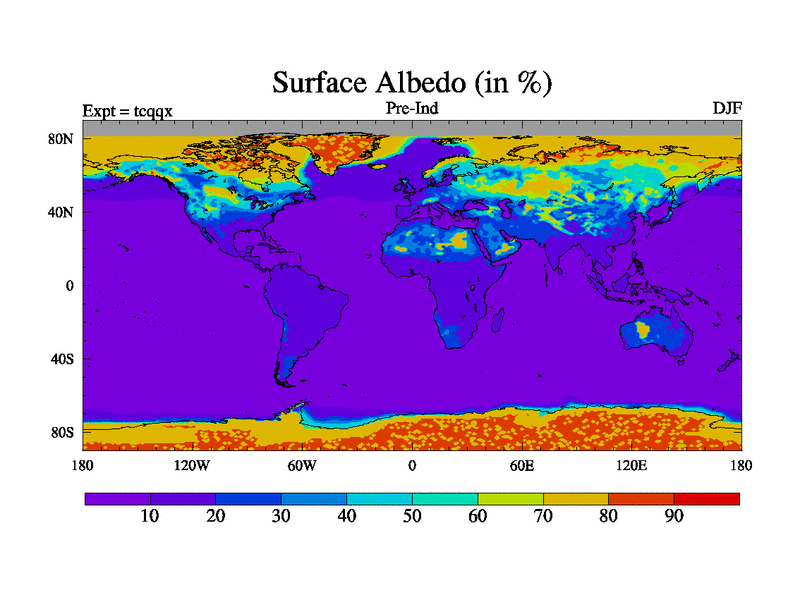
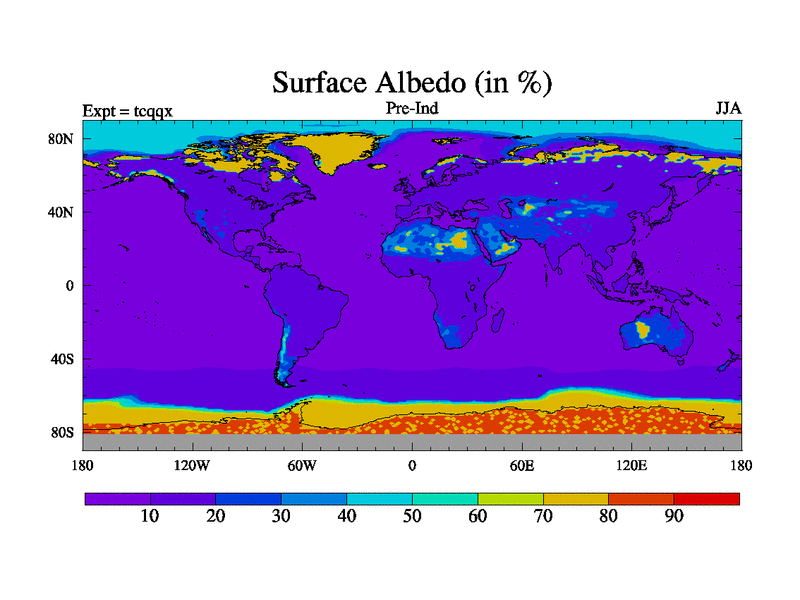
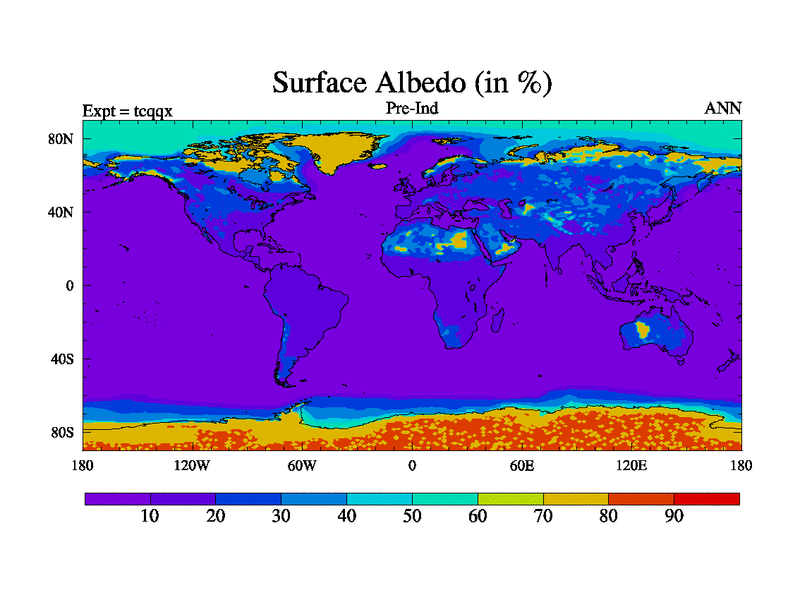
Surface Albedo
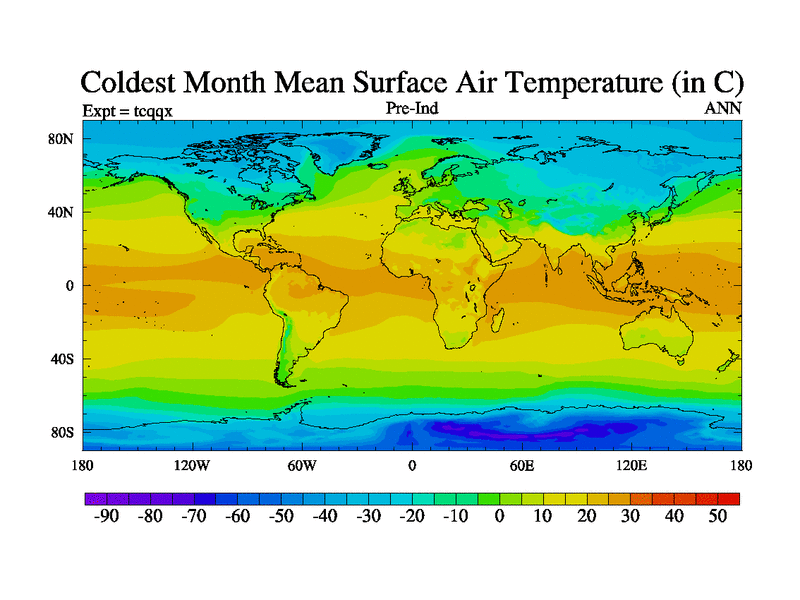
Cold Month Mean
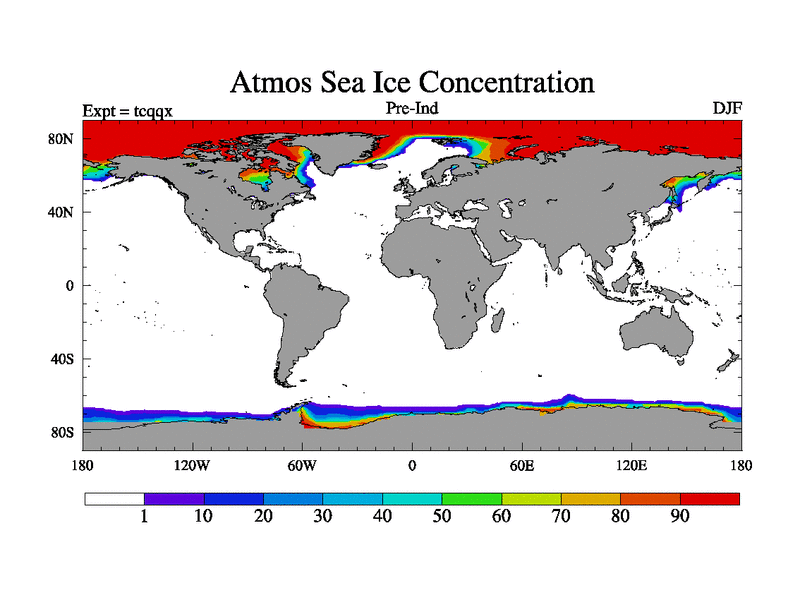
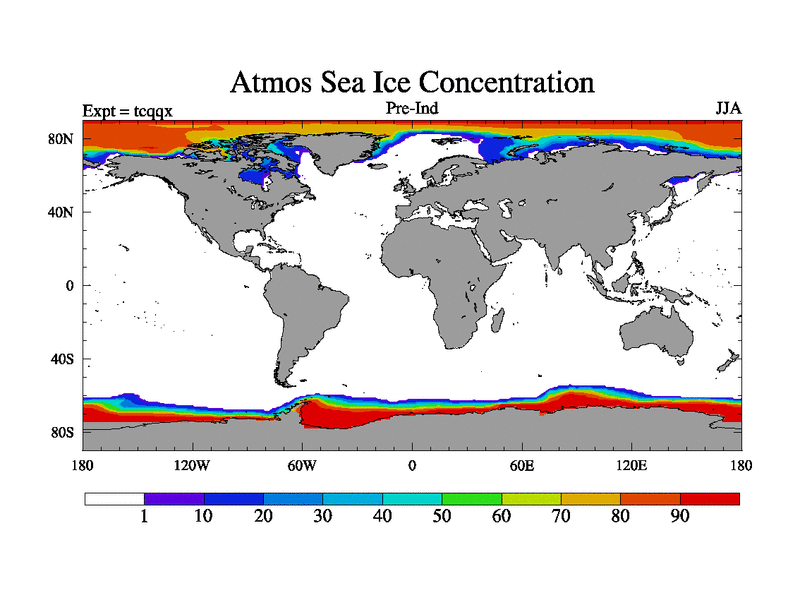
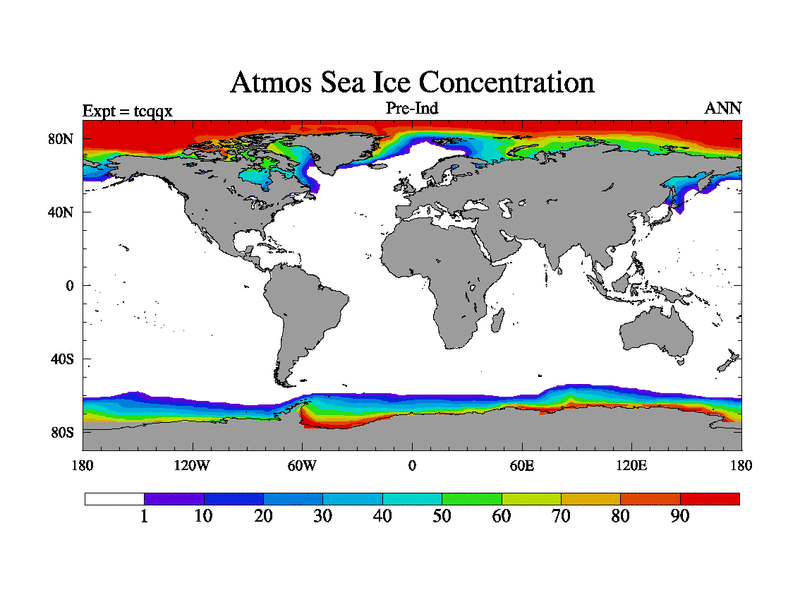
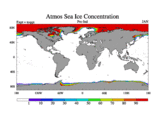
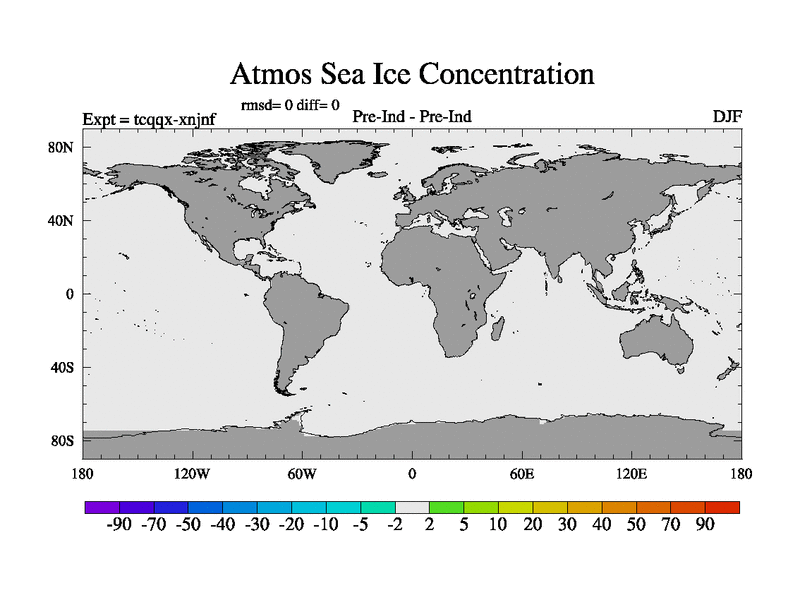
Sea Ice Concentration
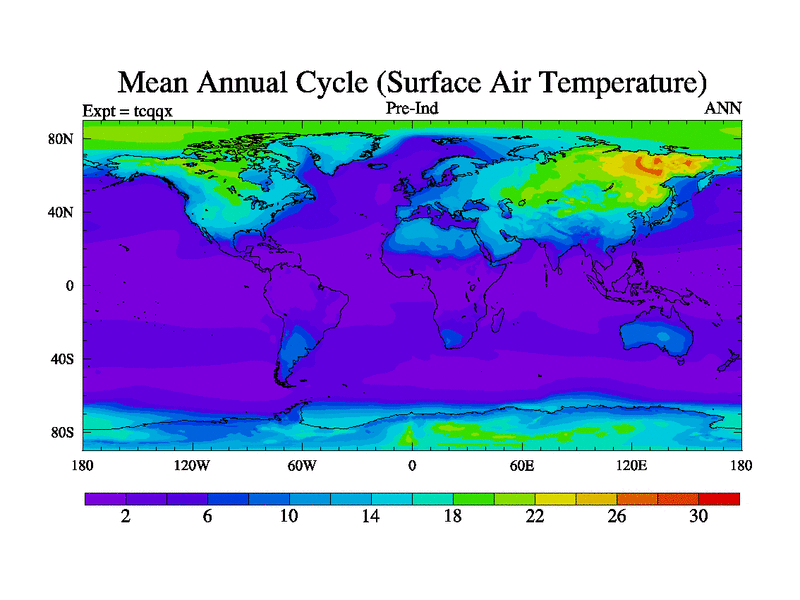
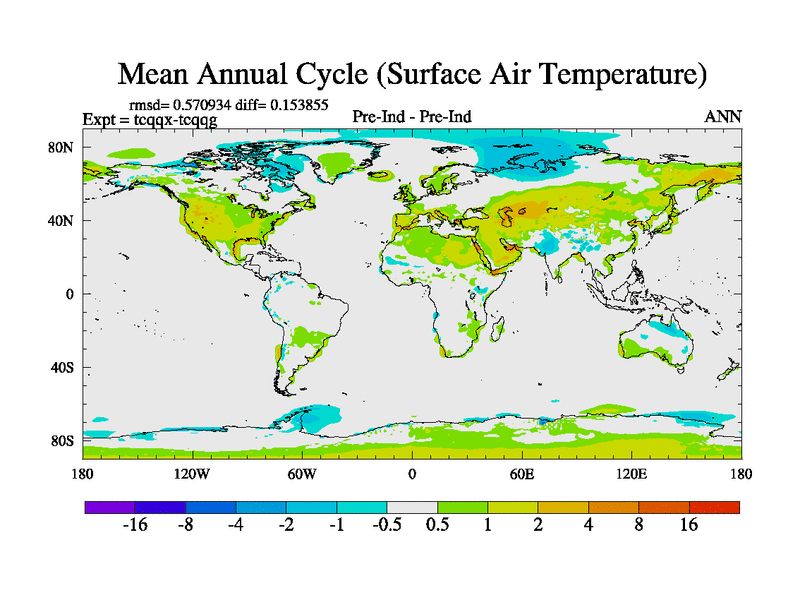
Mean Annual Temperature Cycle
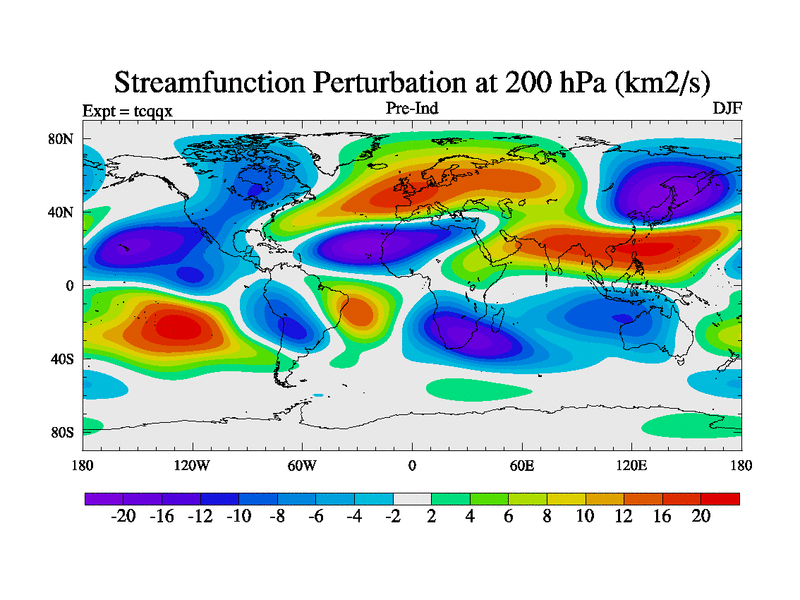
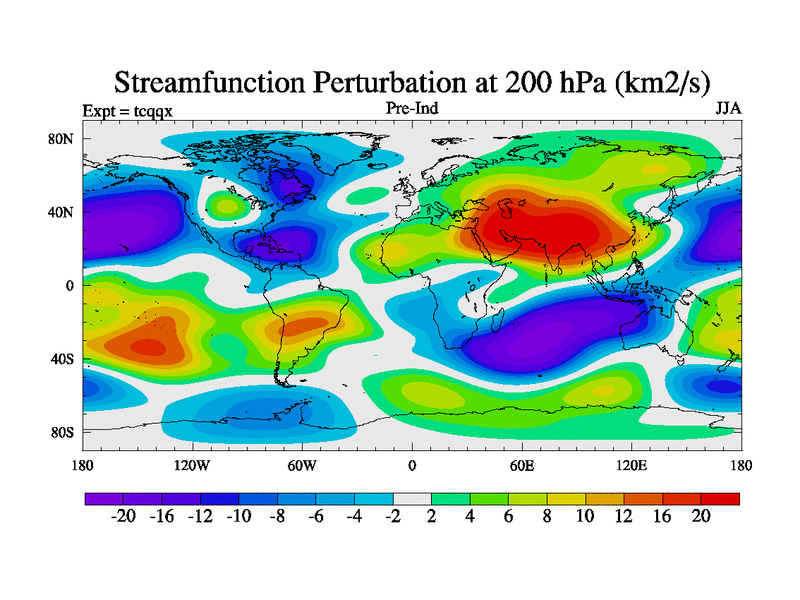
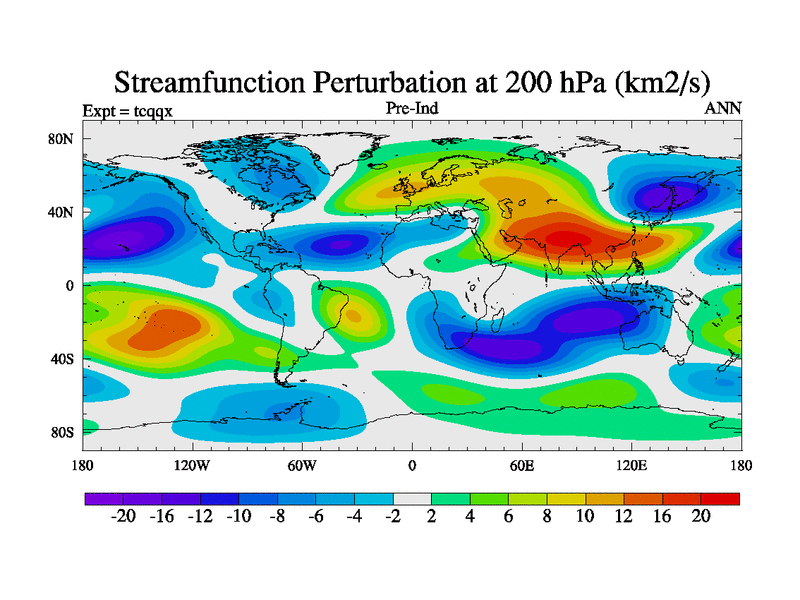
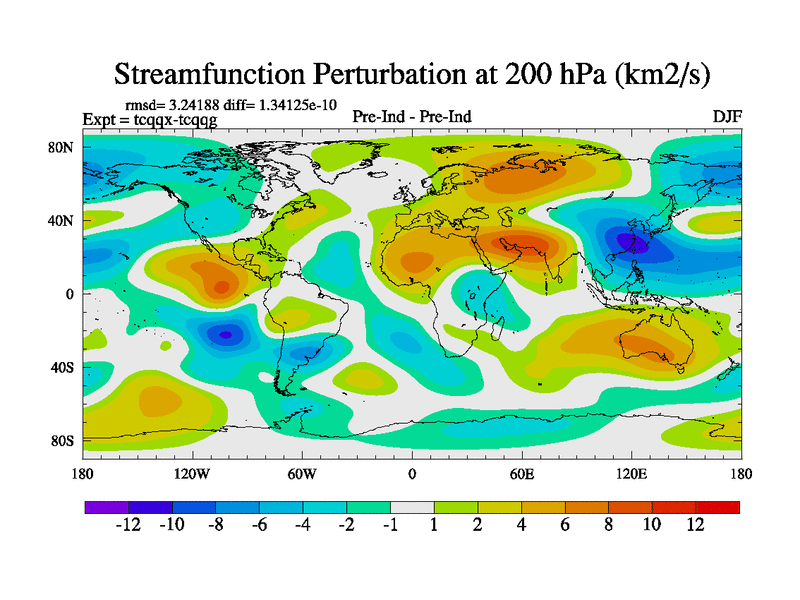
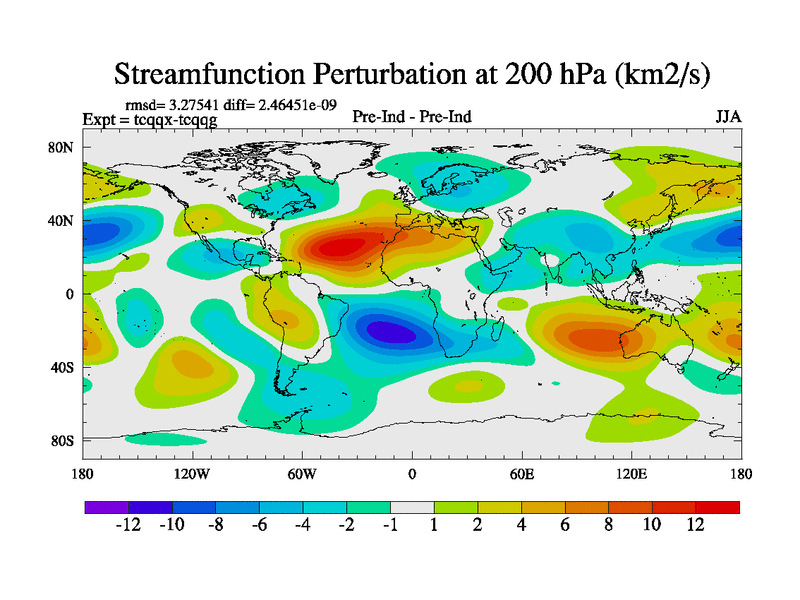
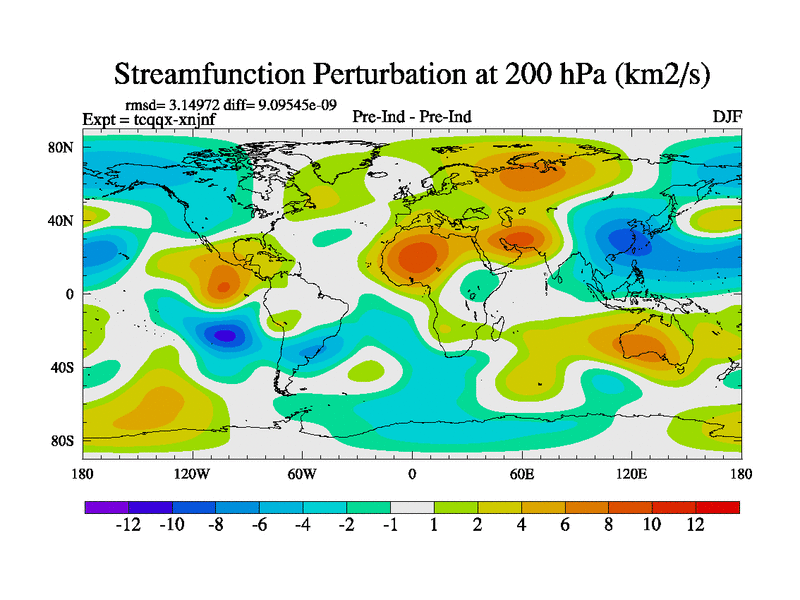
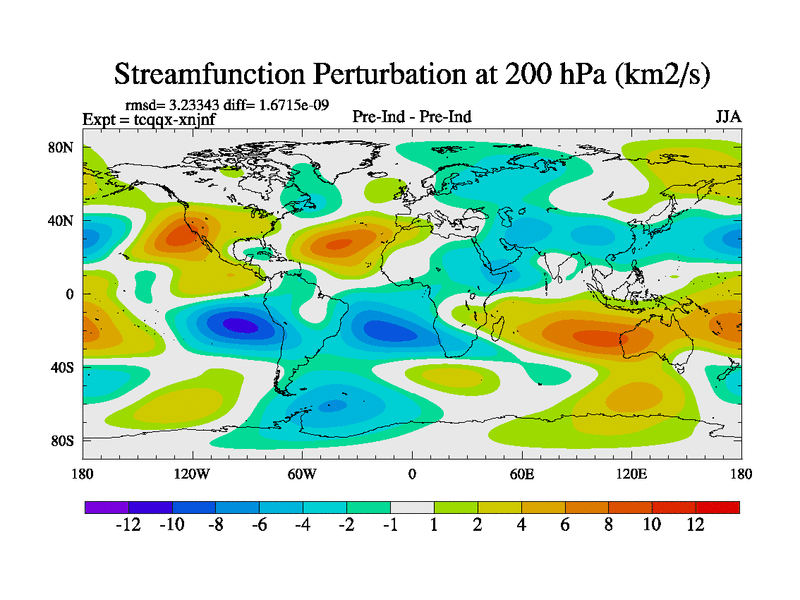
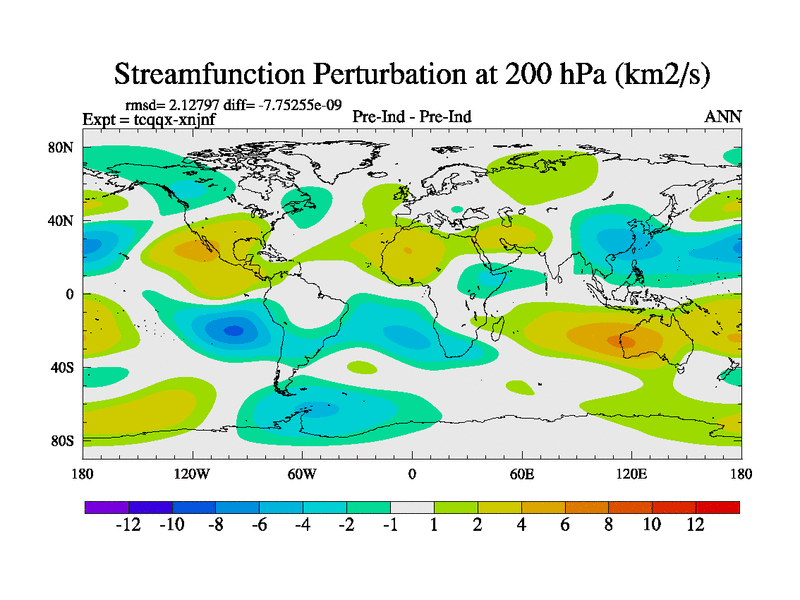
Stream Function at 200 hPa
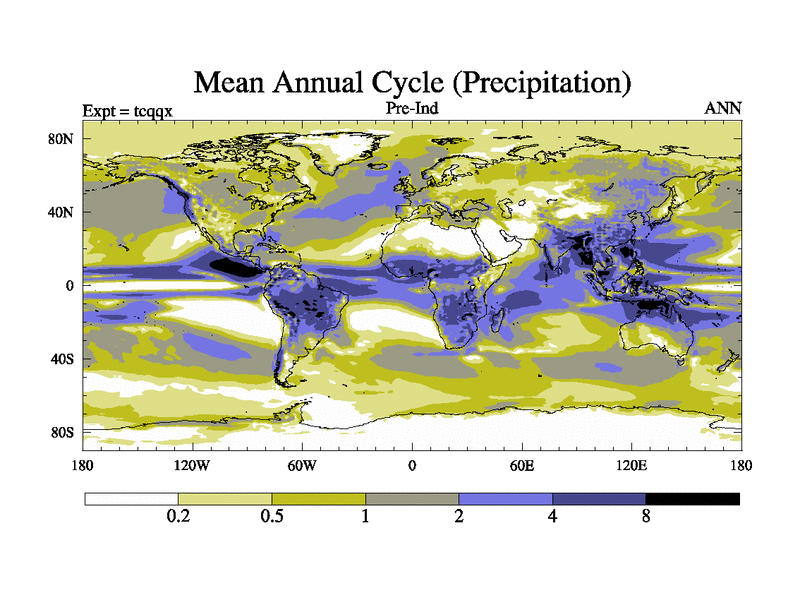
Mean Annual Precipitation Cycle
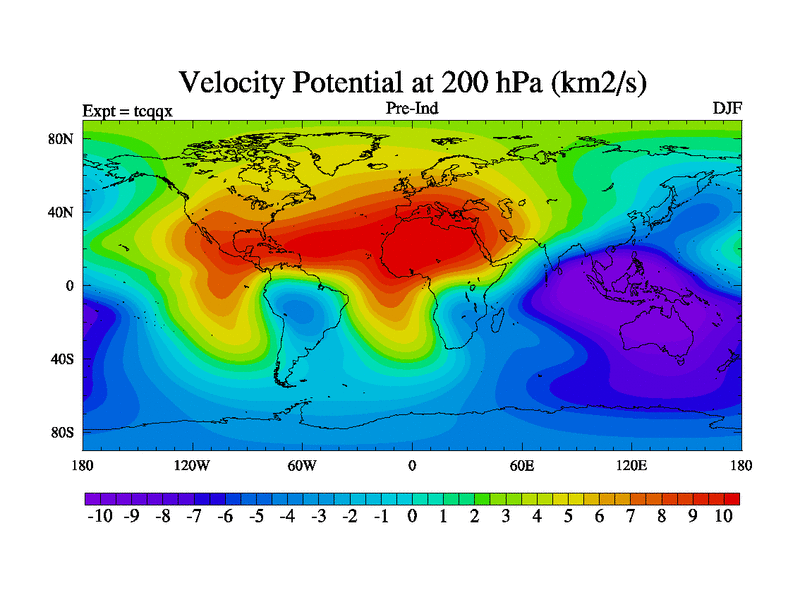
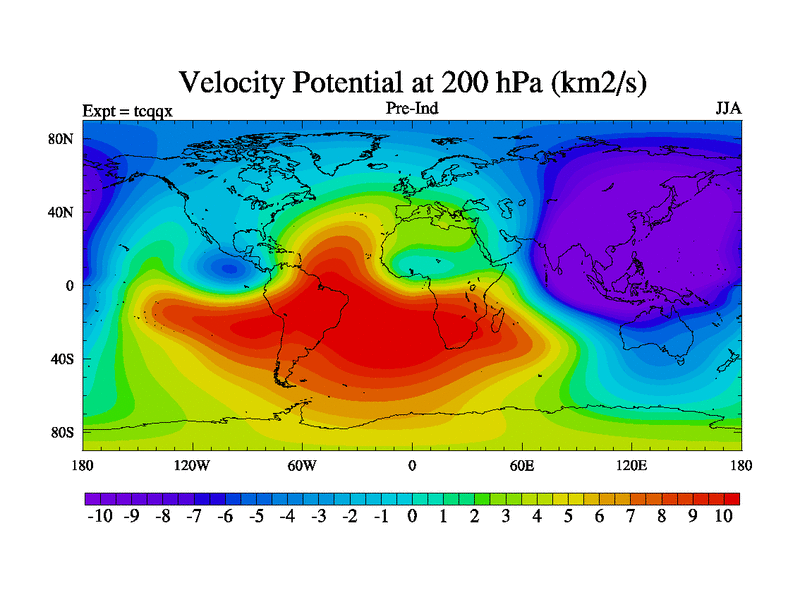
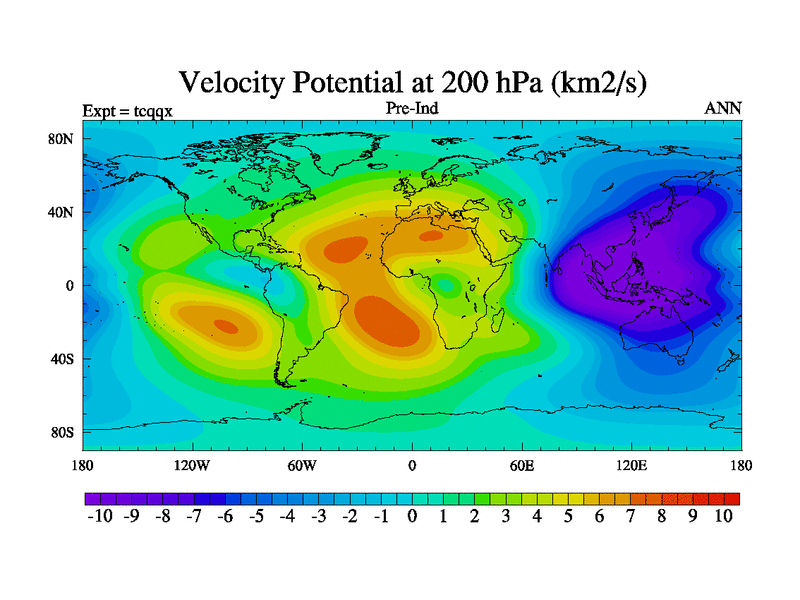
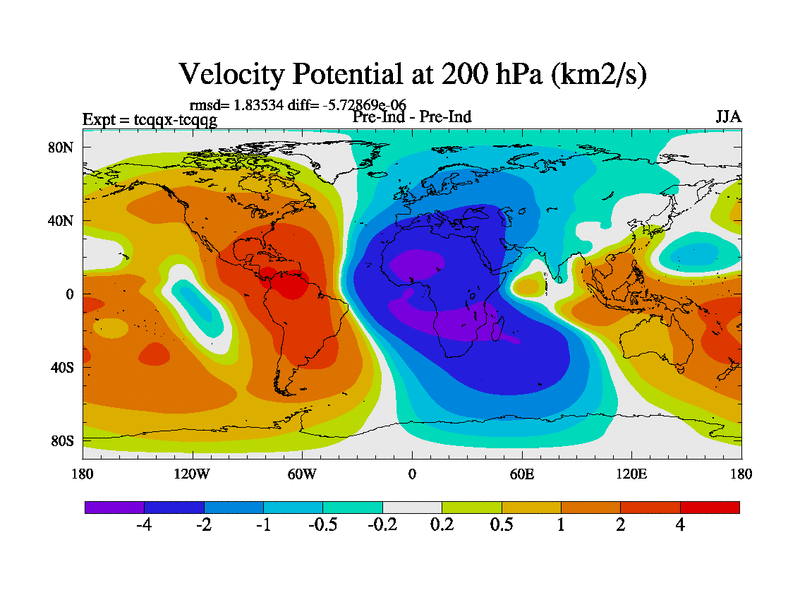
Velocity Potential at 200 hPa
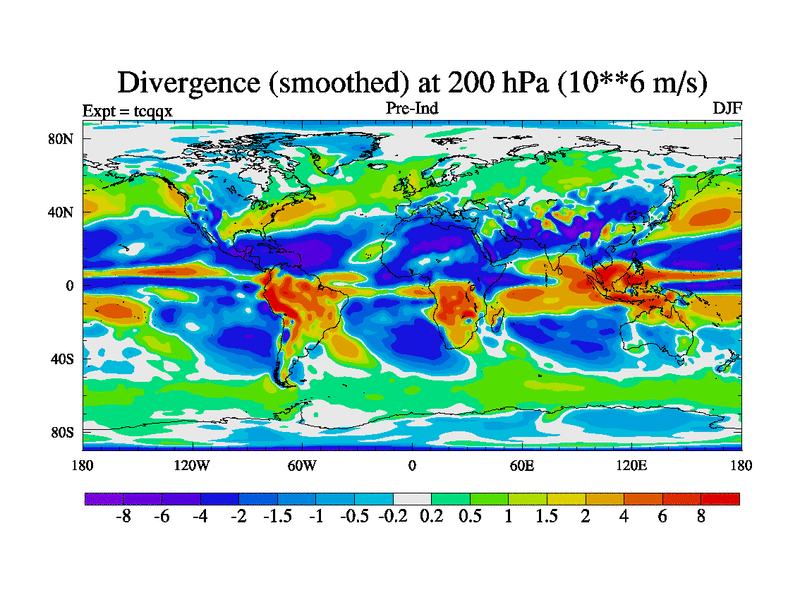
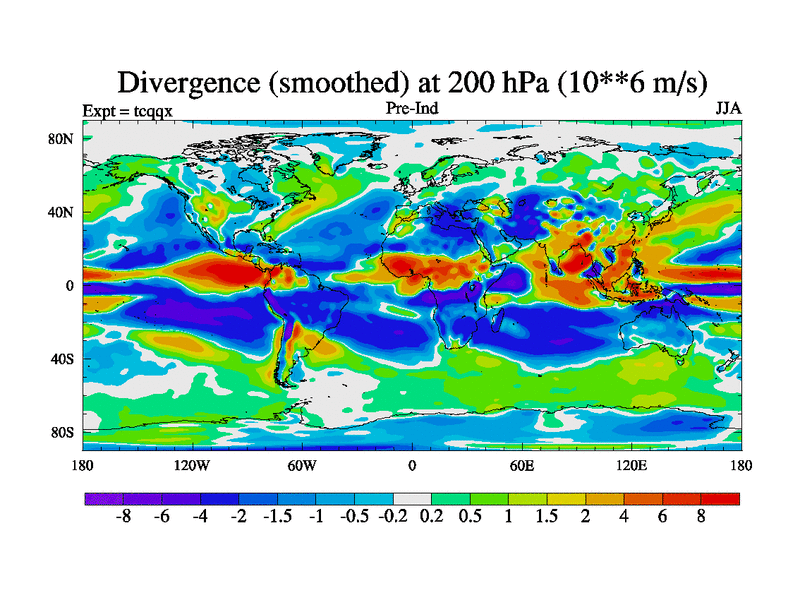
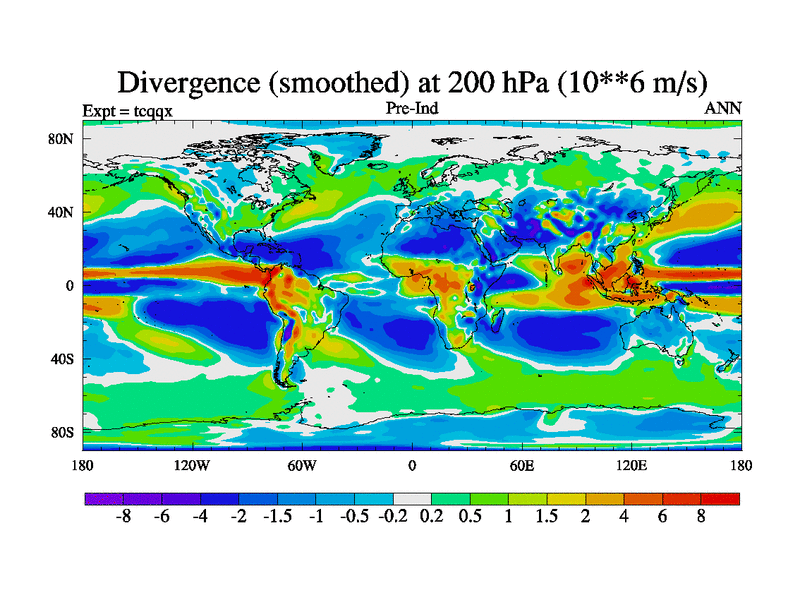
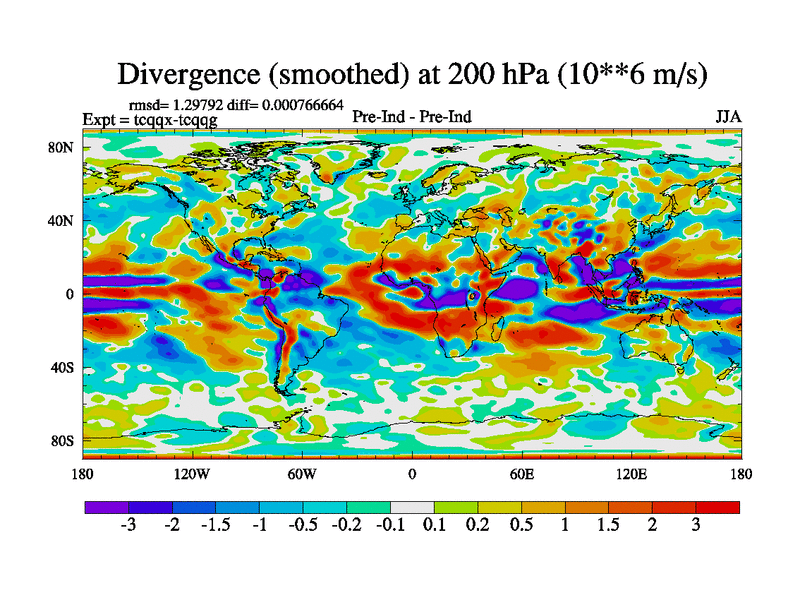
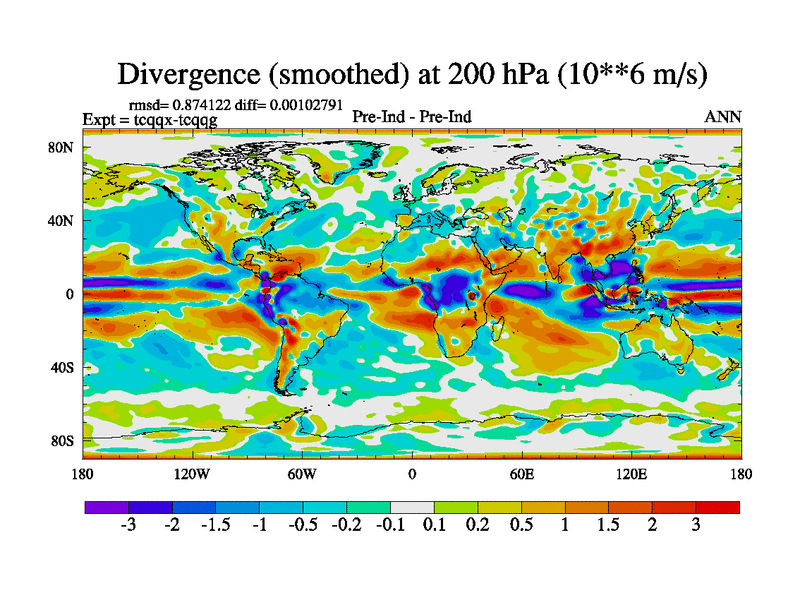
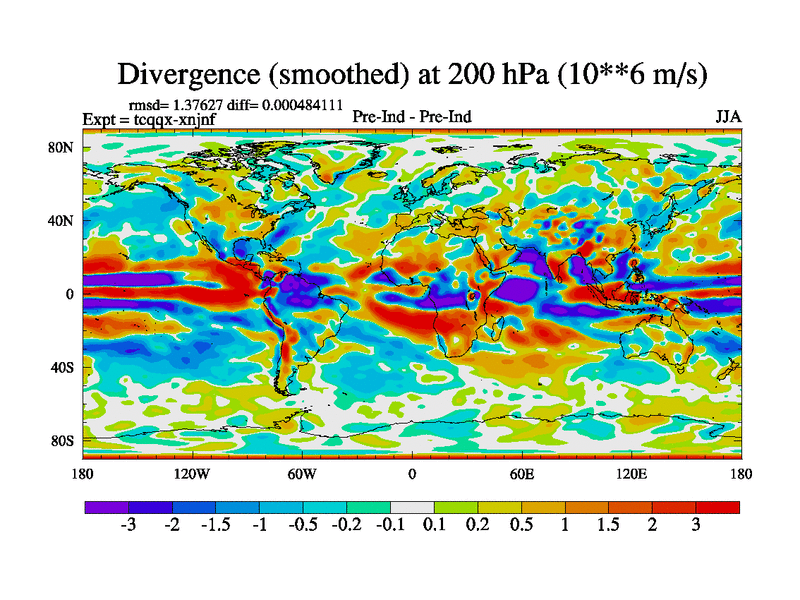
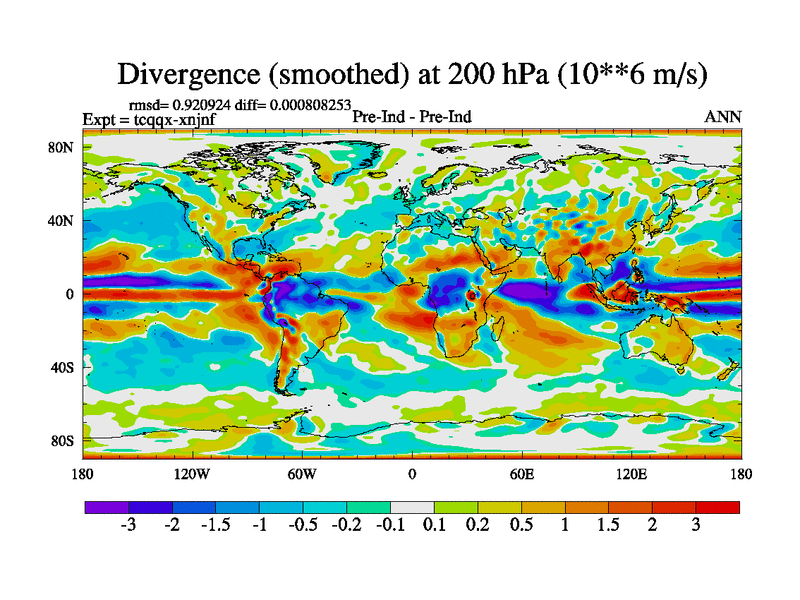
Divergence (Smoothed) at 200 hPa
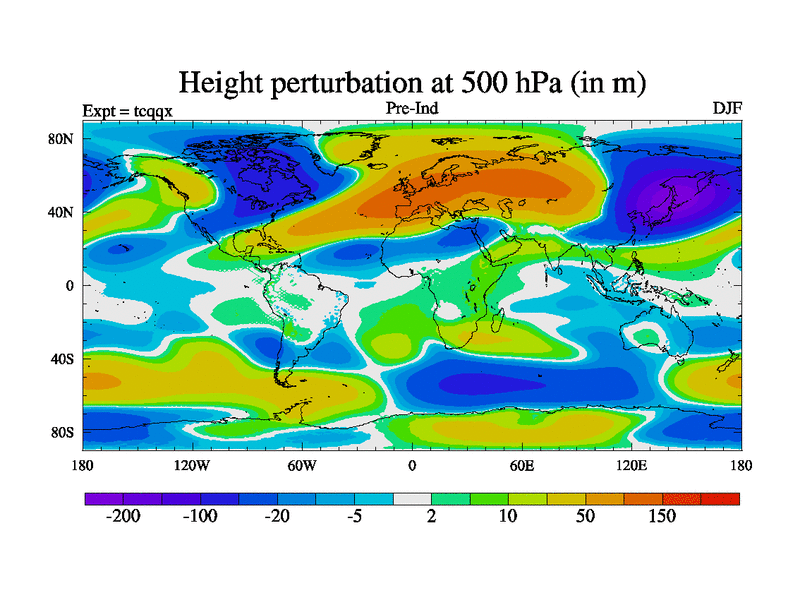
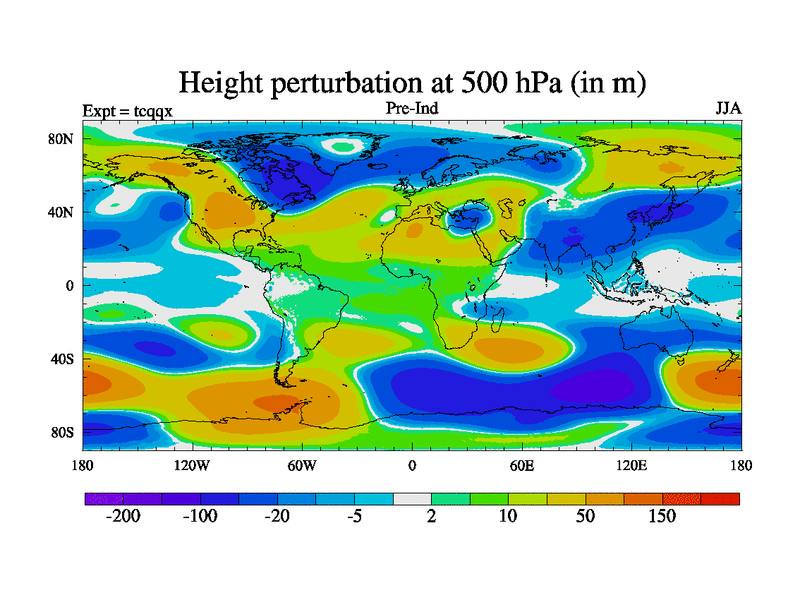
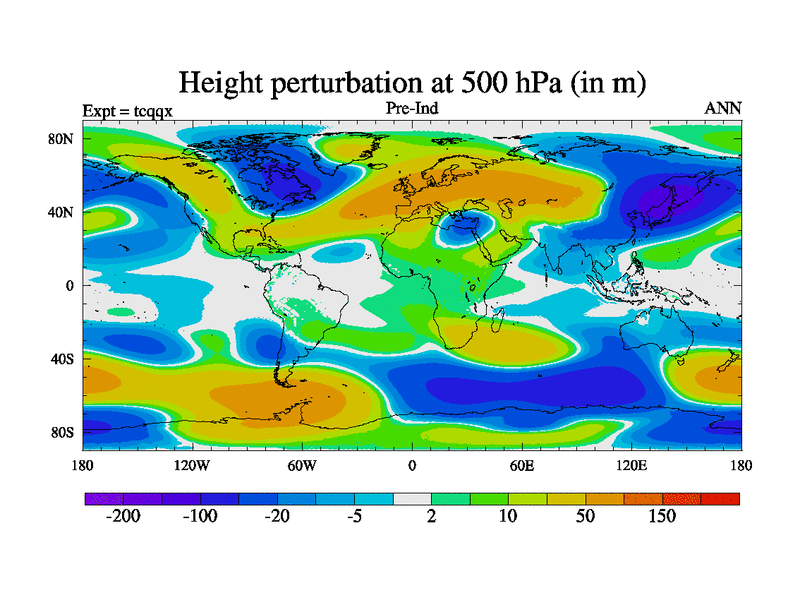
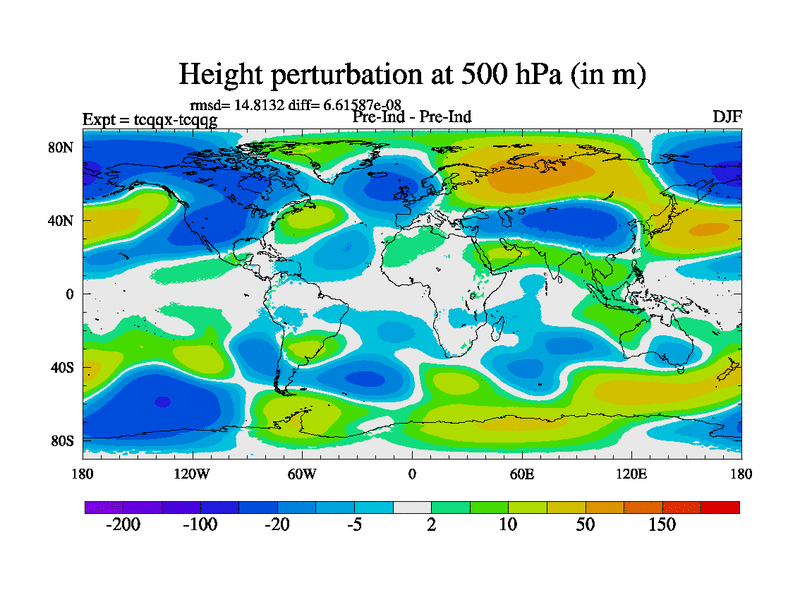
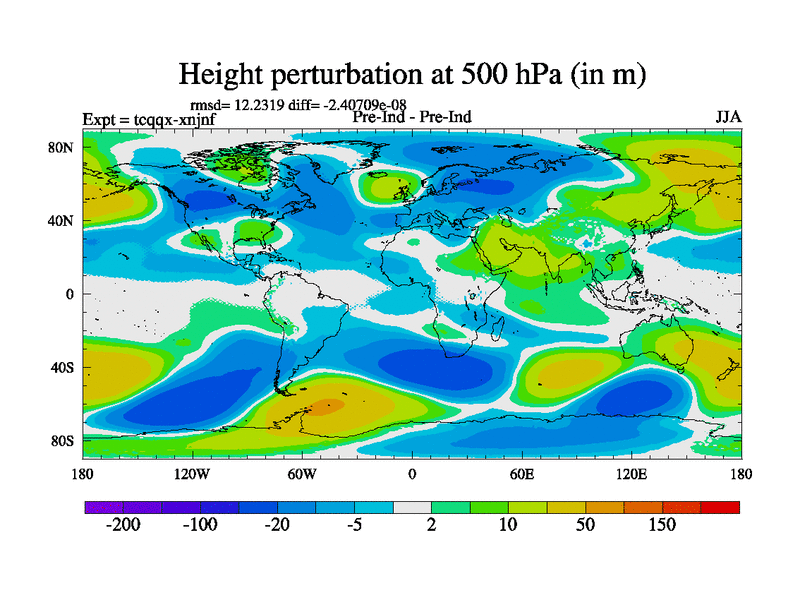
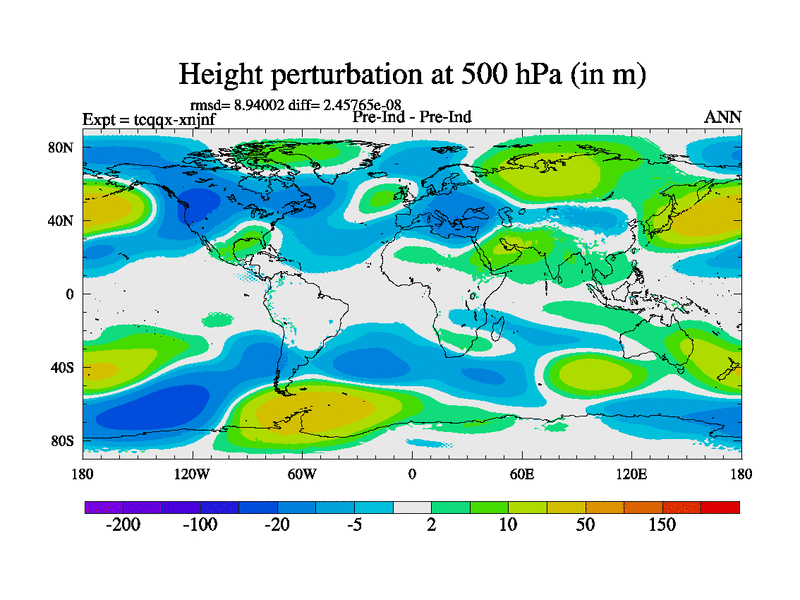
Perturbation Height at 500 hPa
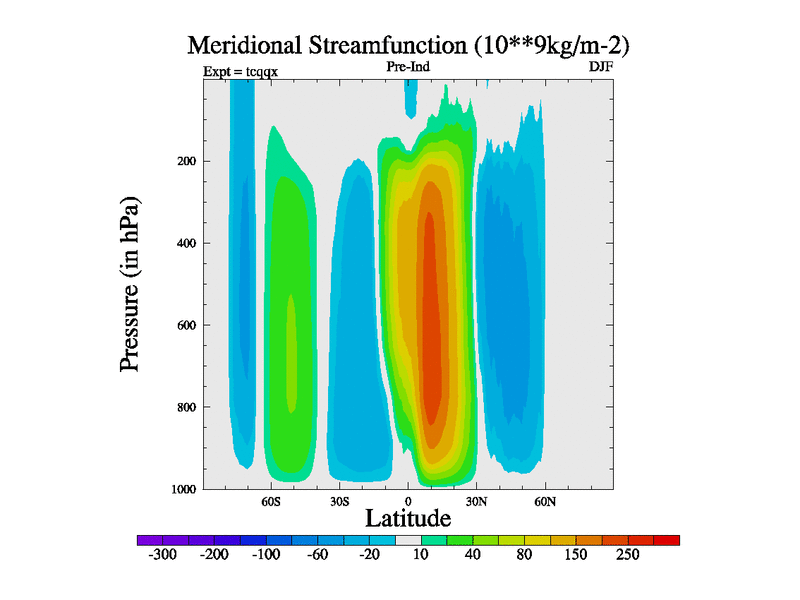
Meridional Stream Function
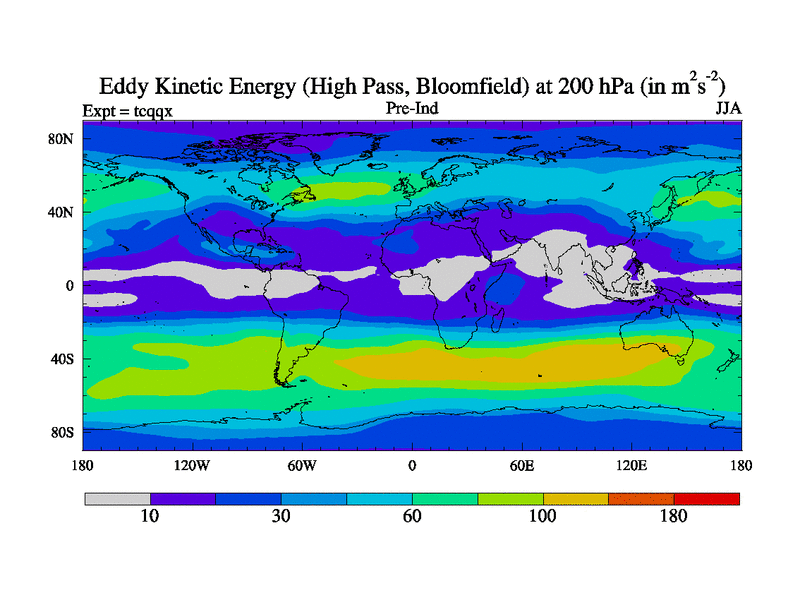
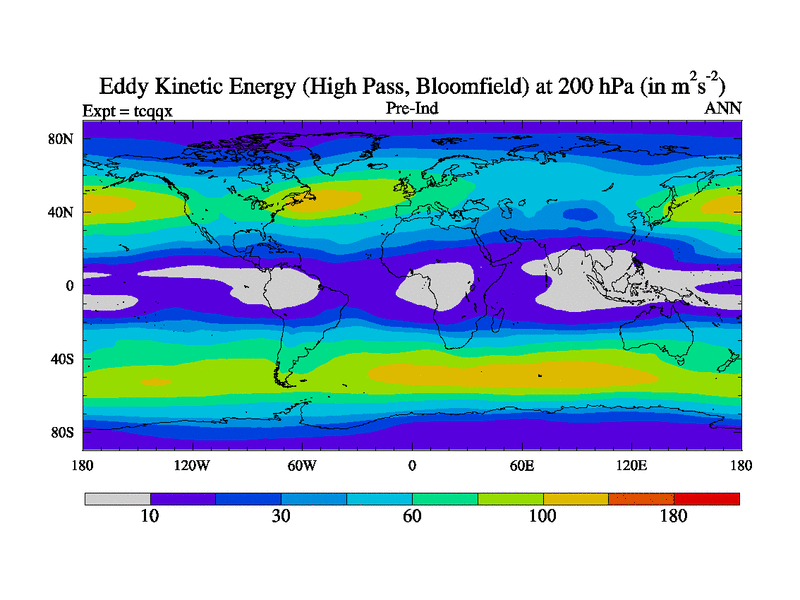
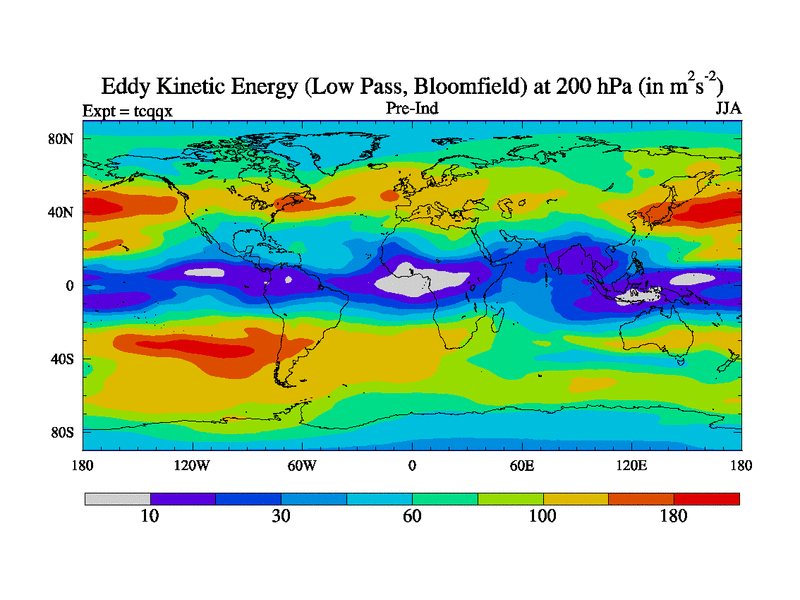
High Pass Eddy Kinetic Energy at 200 hPa
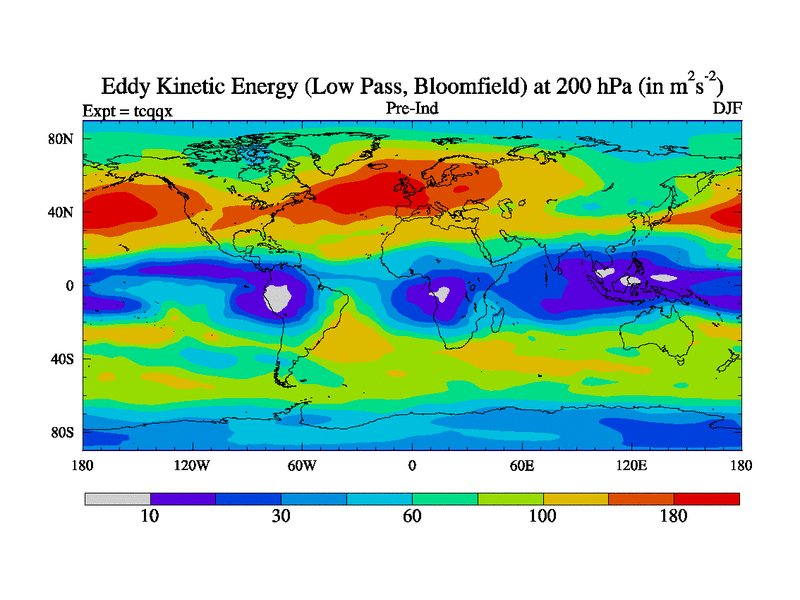
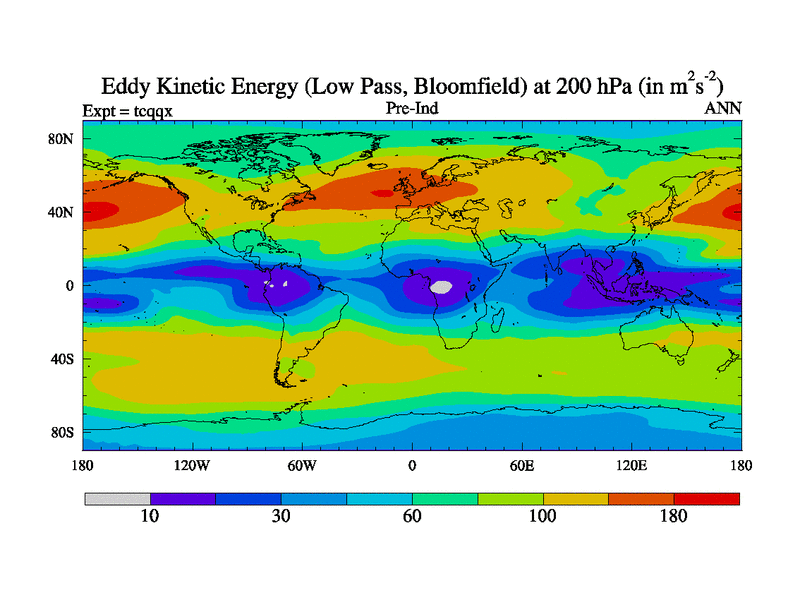
Low Pass Eddy Kinetic Energy at 200 hPa
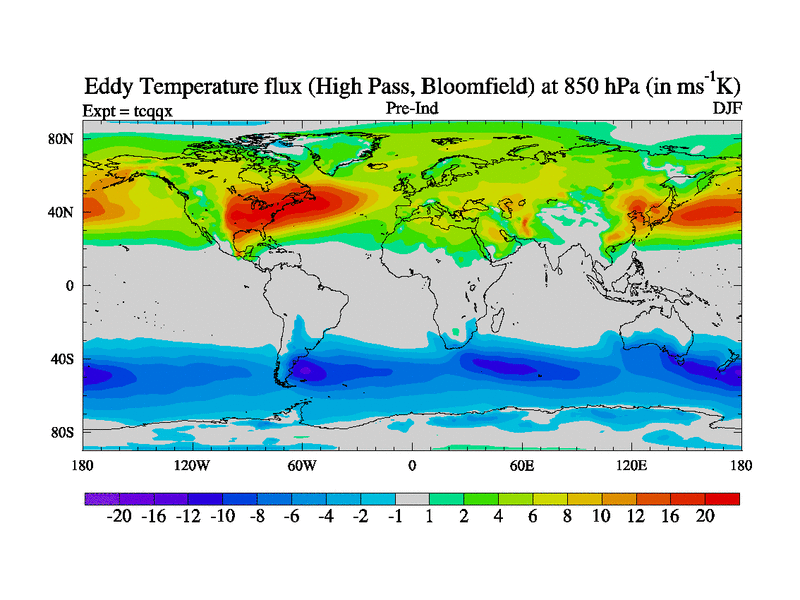
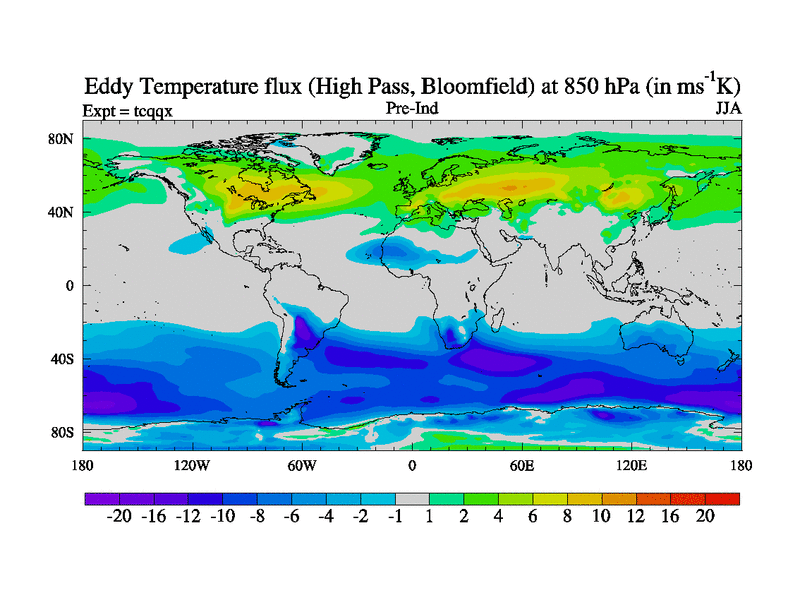
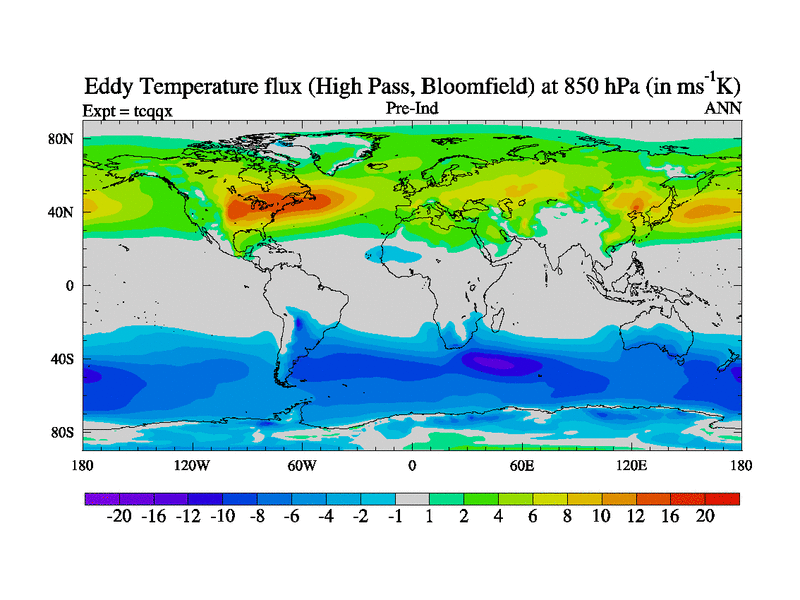
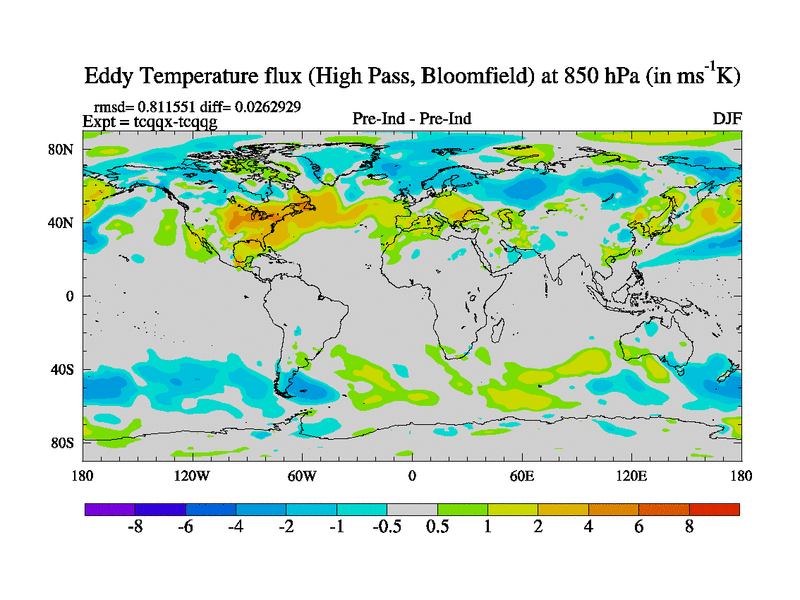
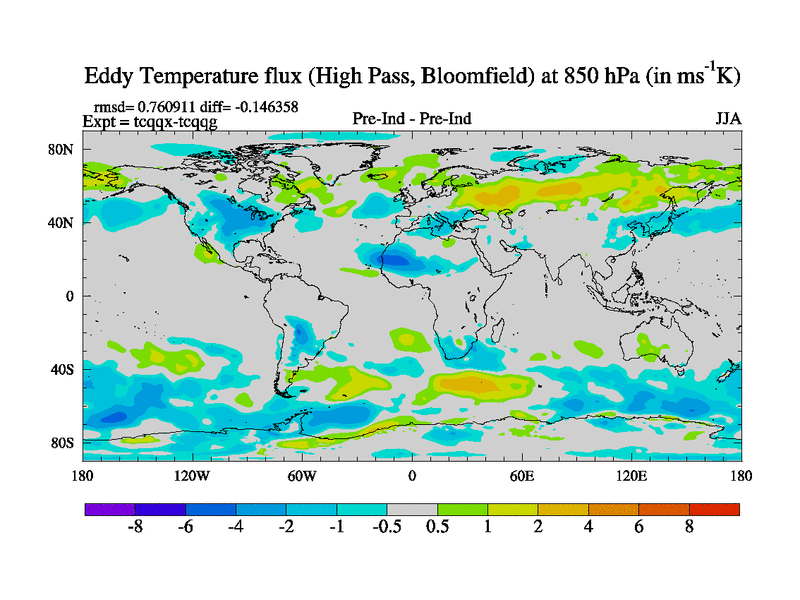
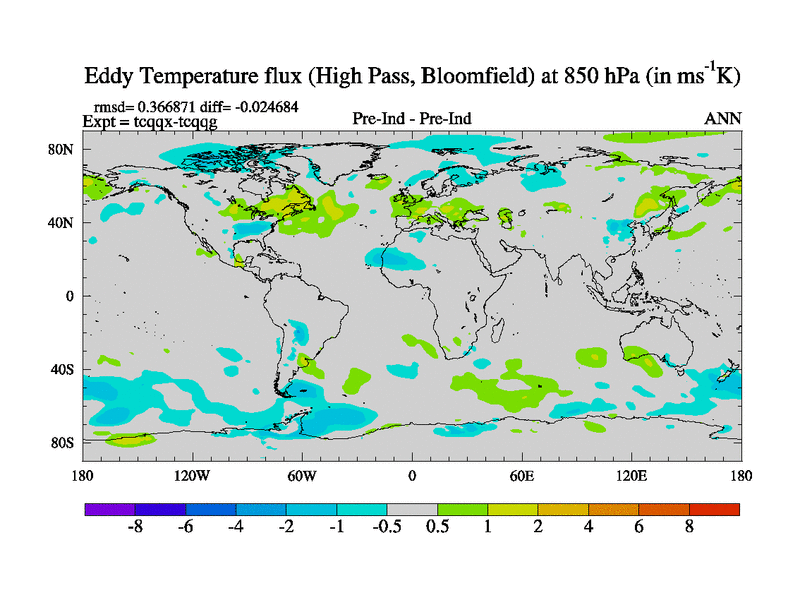
High Pass Temperature Flux at 850 hPa
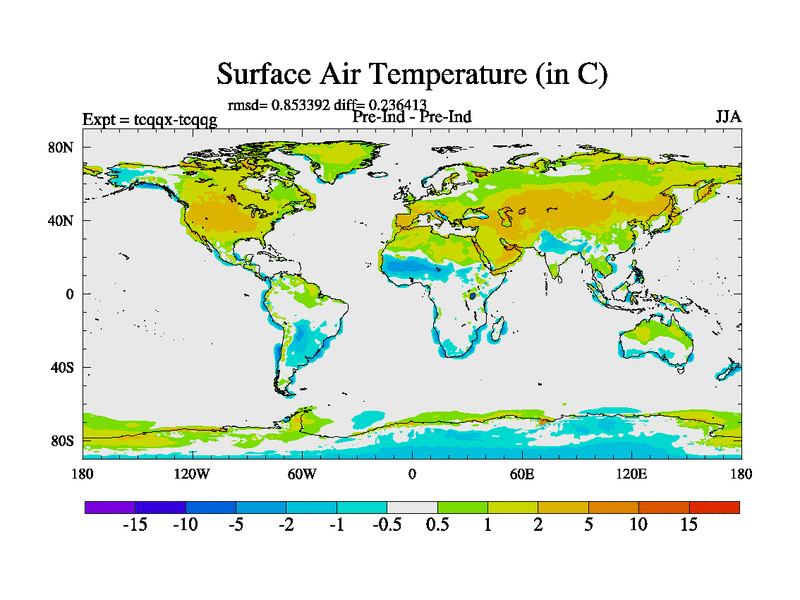
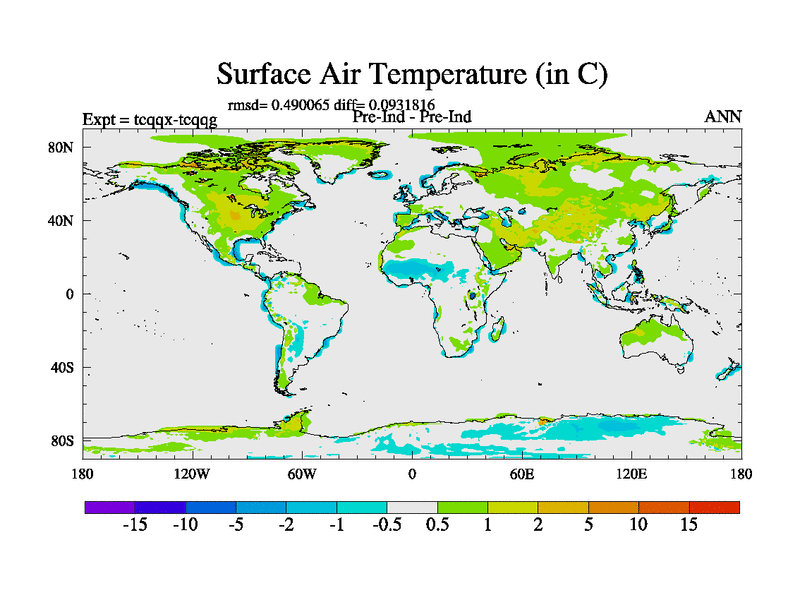
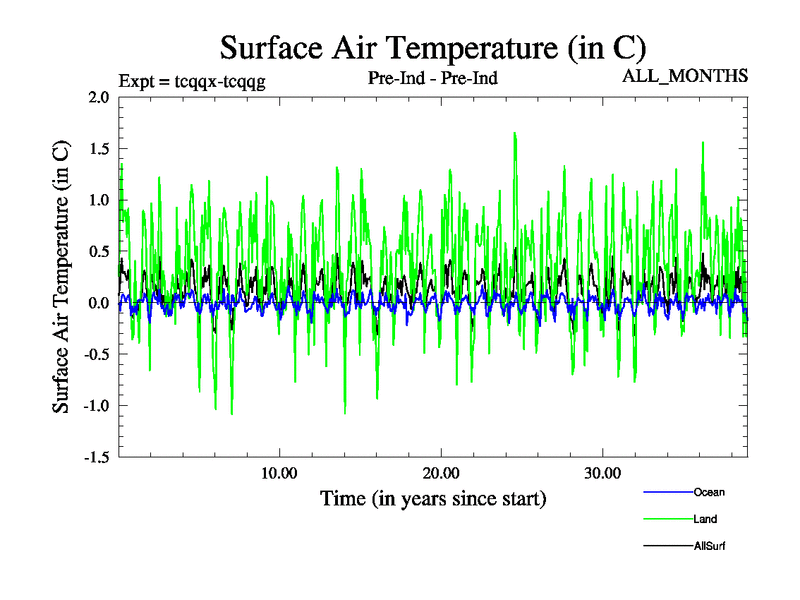
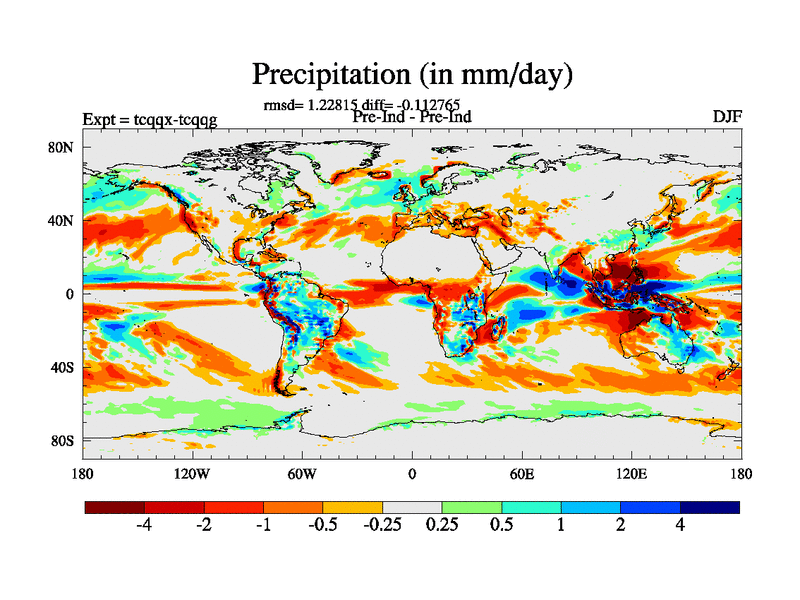
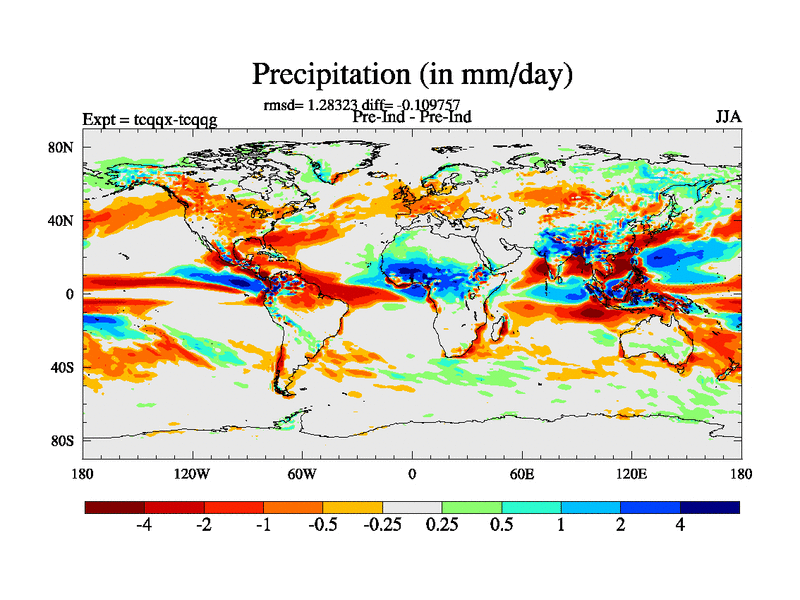
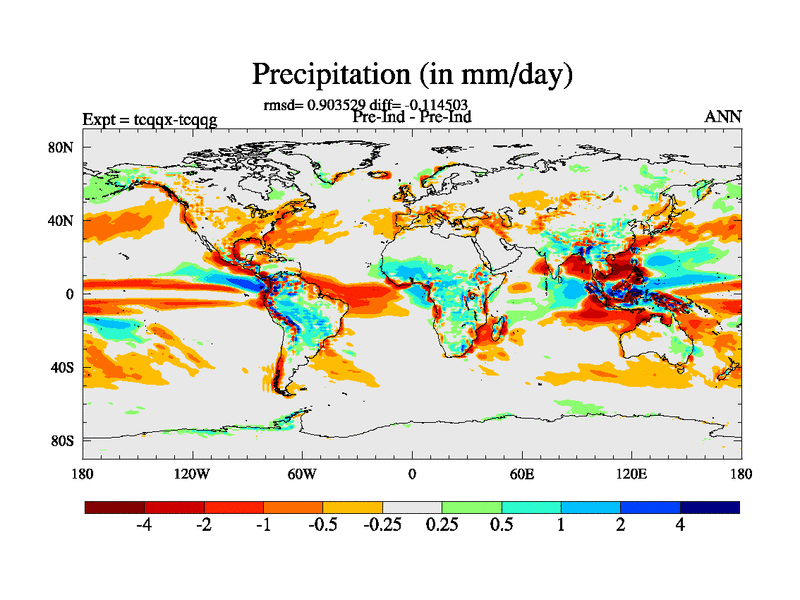
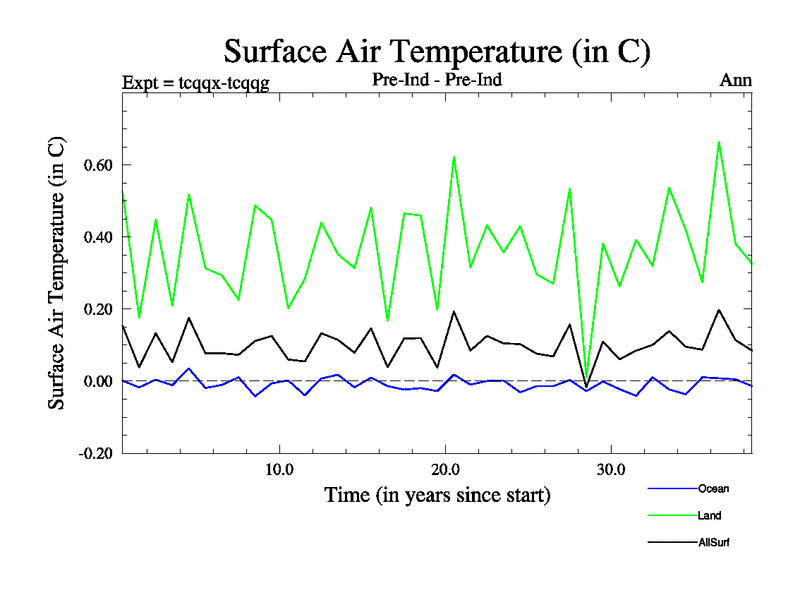
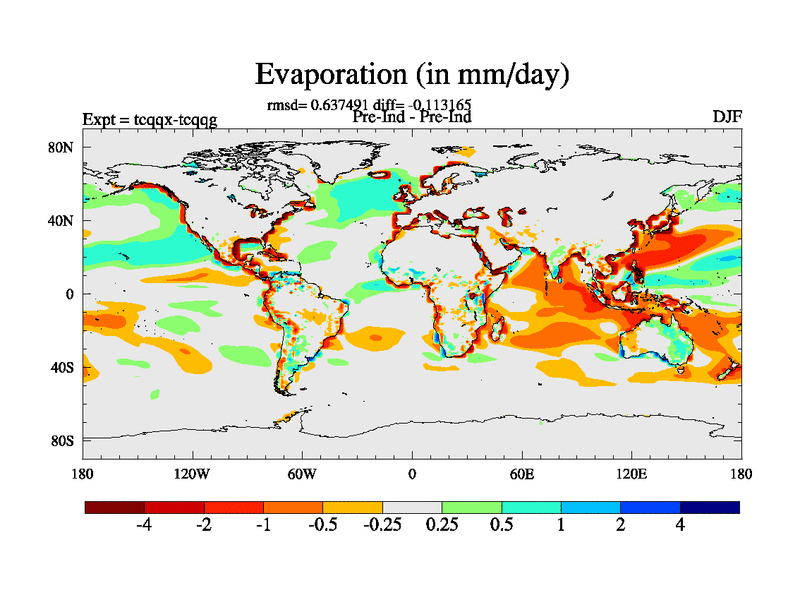
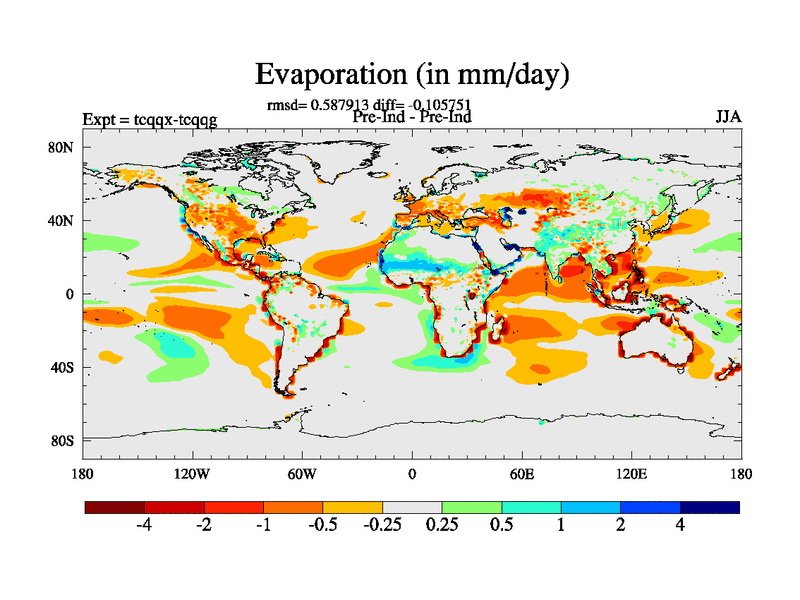
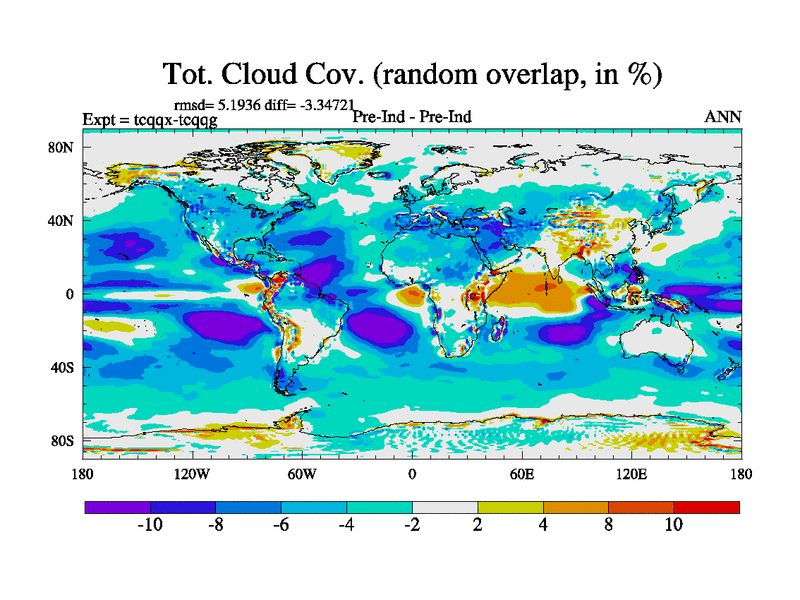
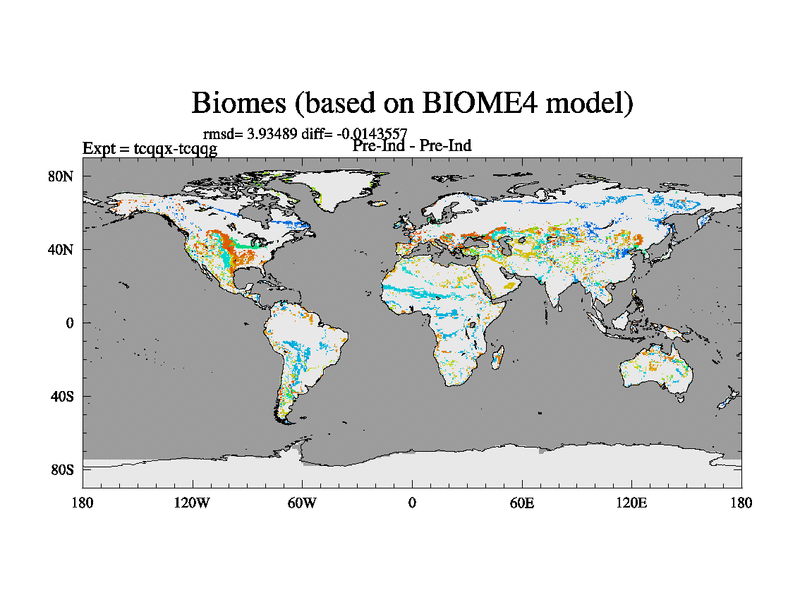
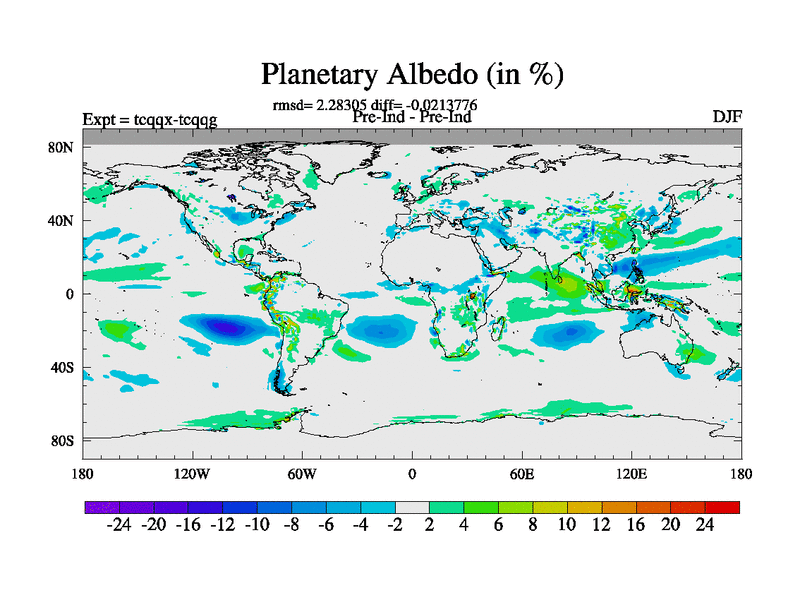
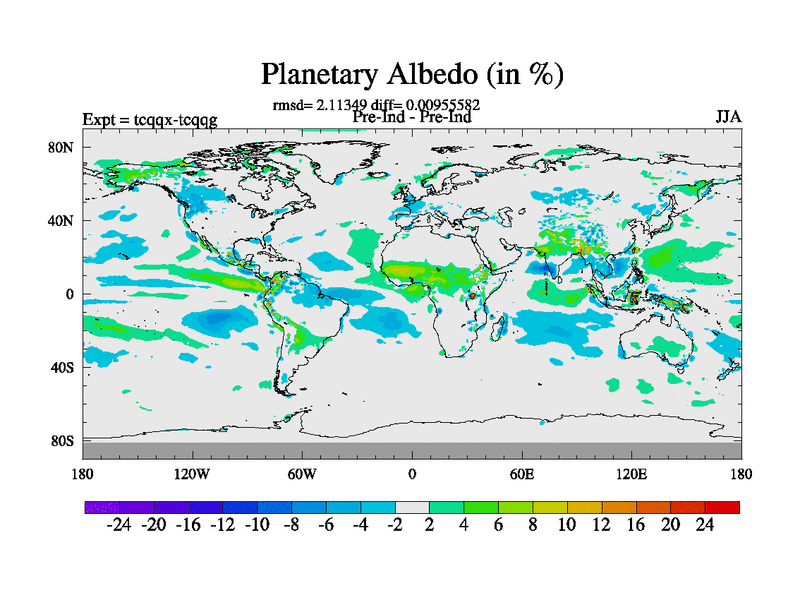
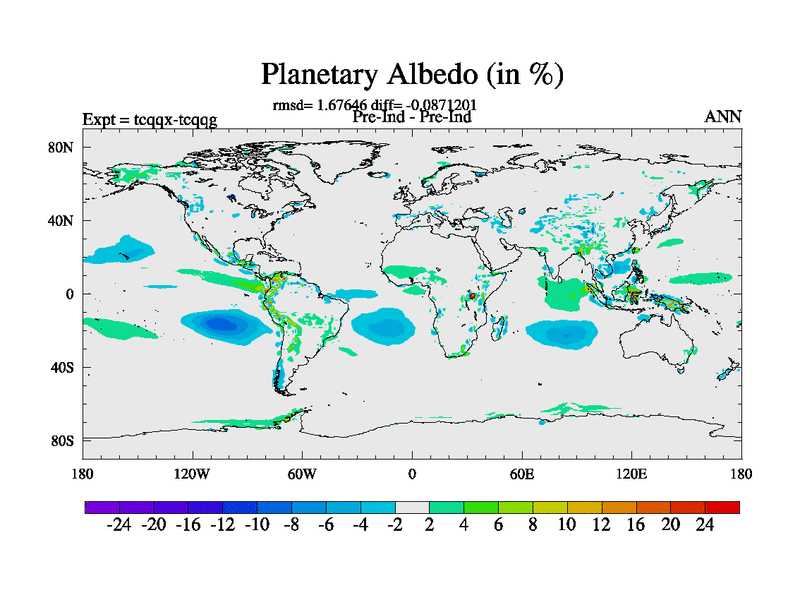
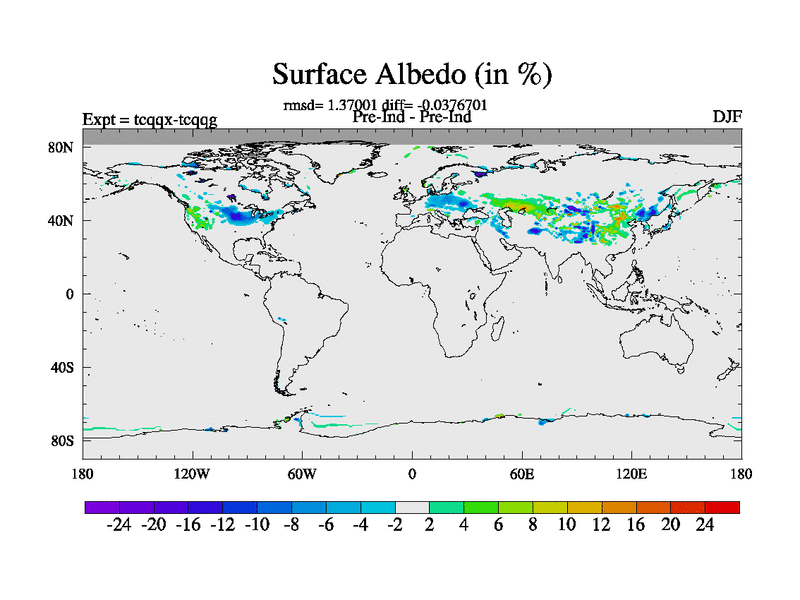
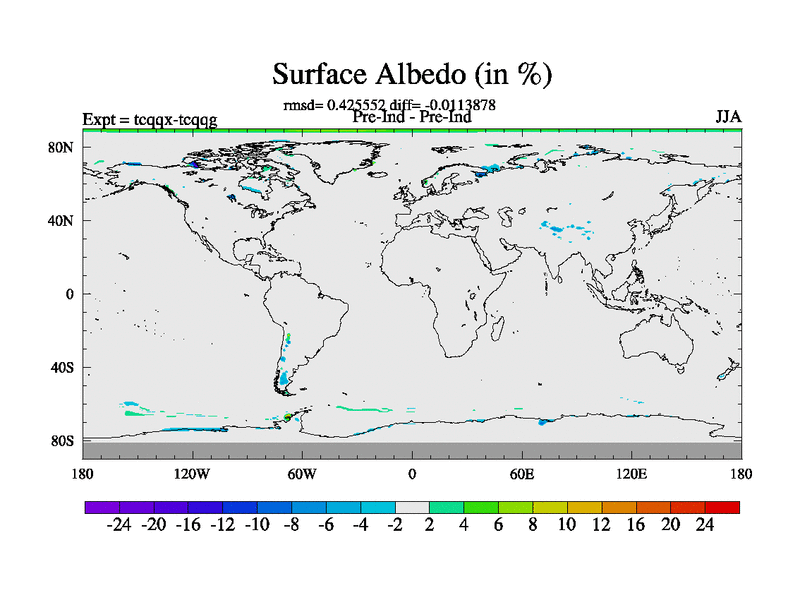
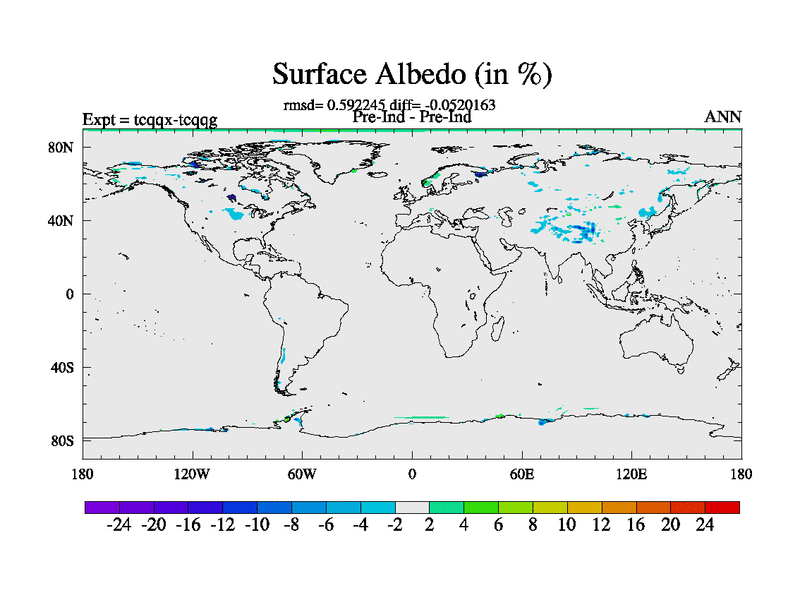
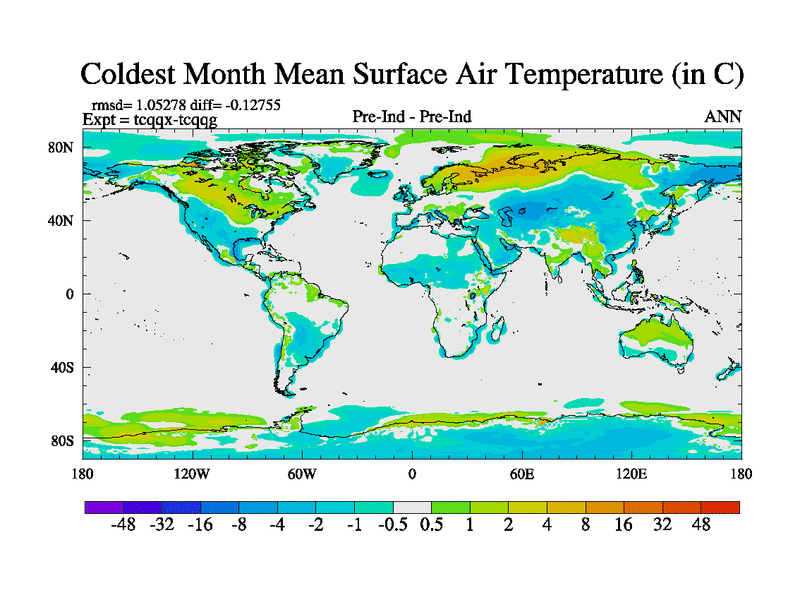
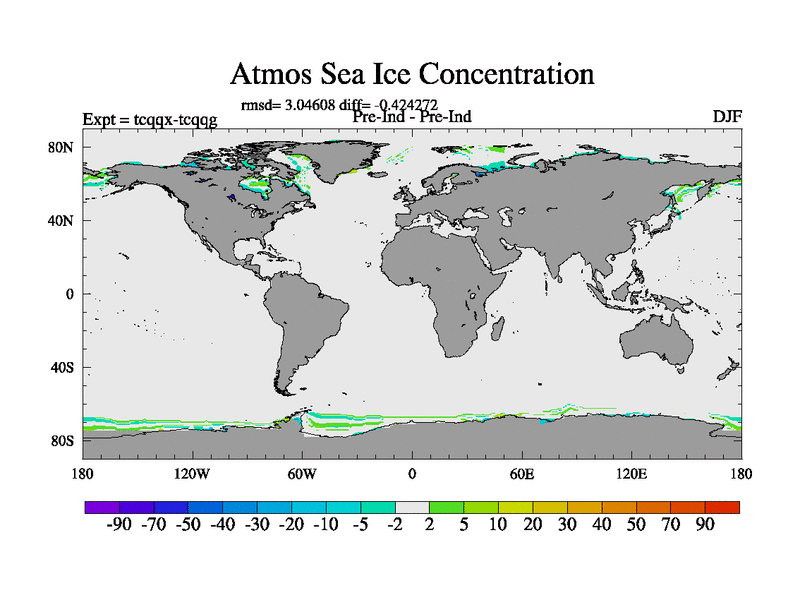
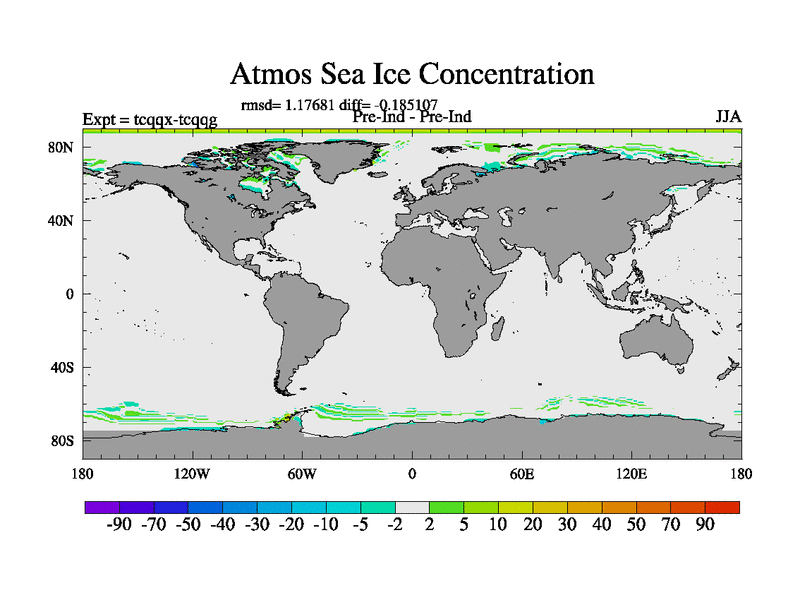
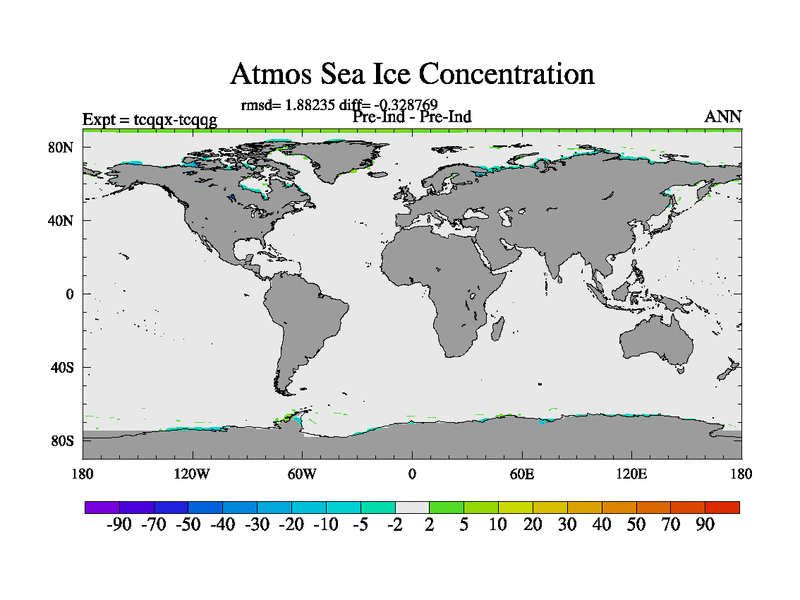
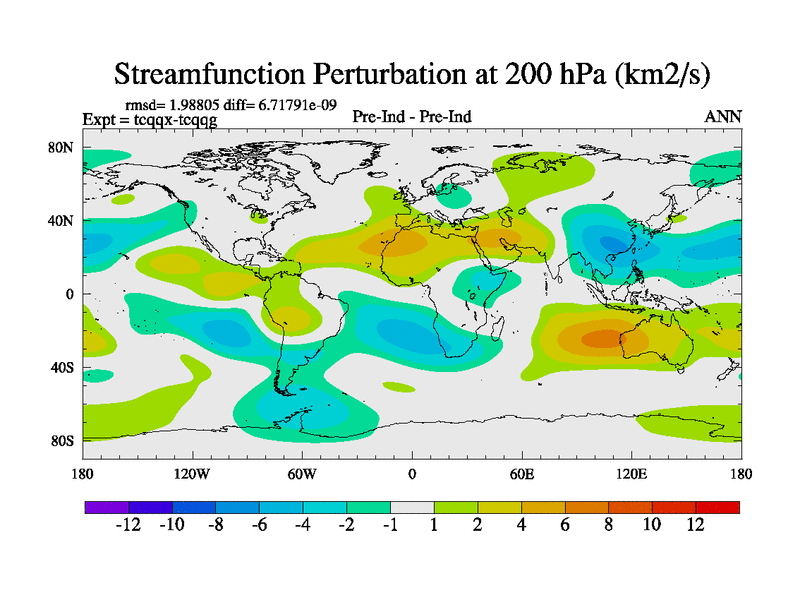
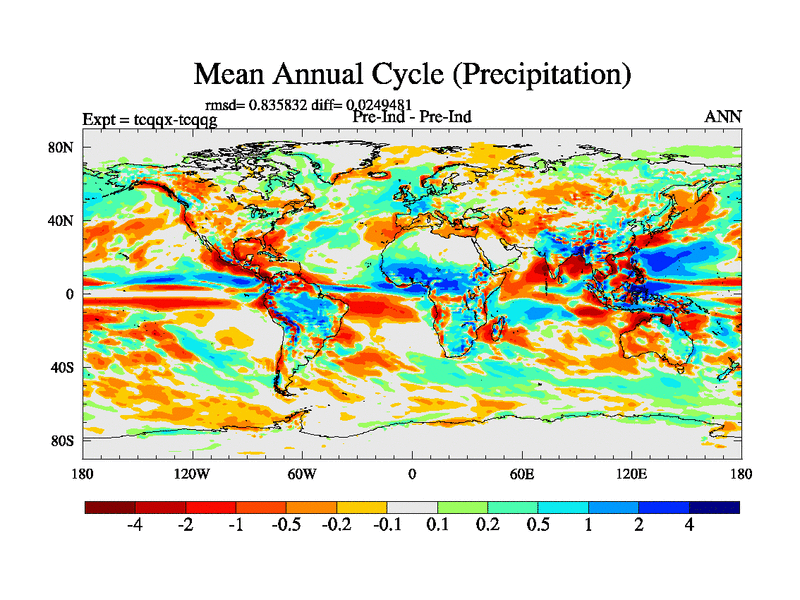
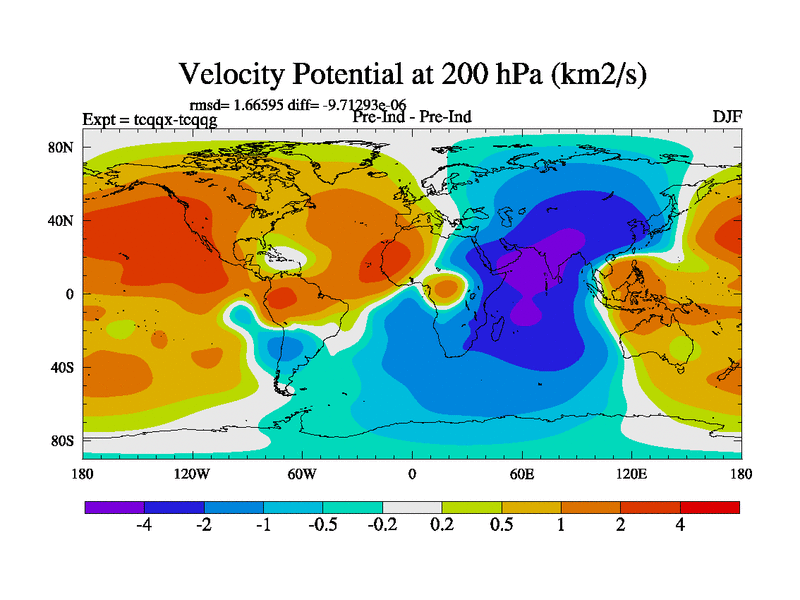
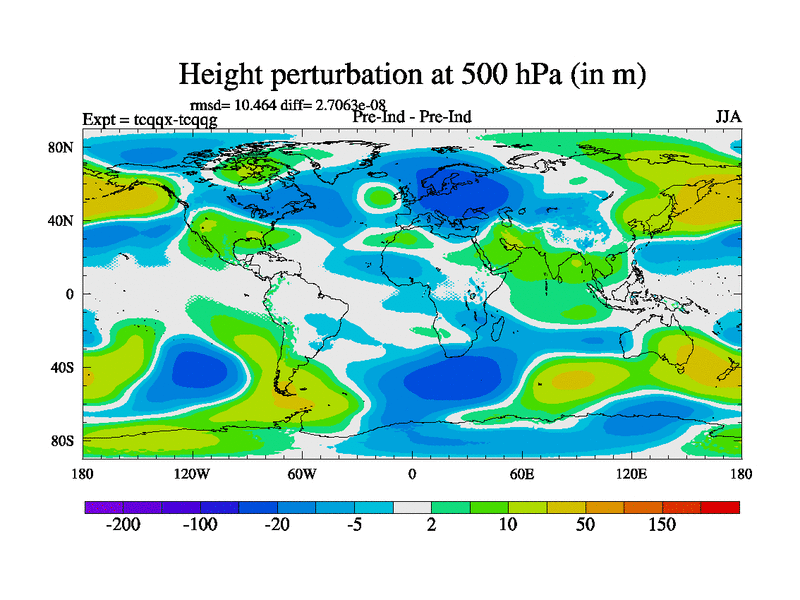
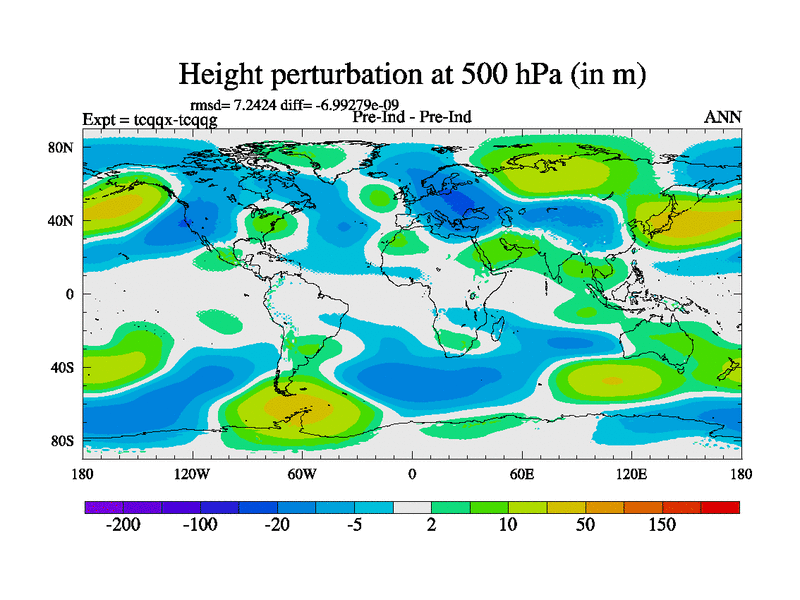
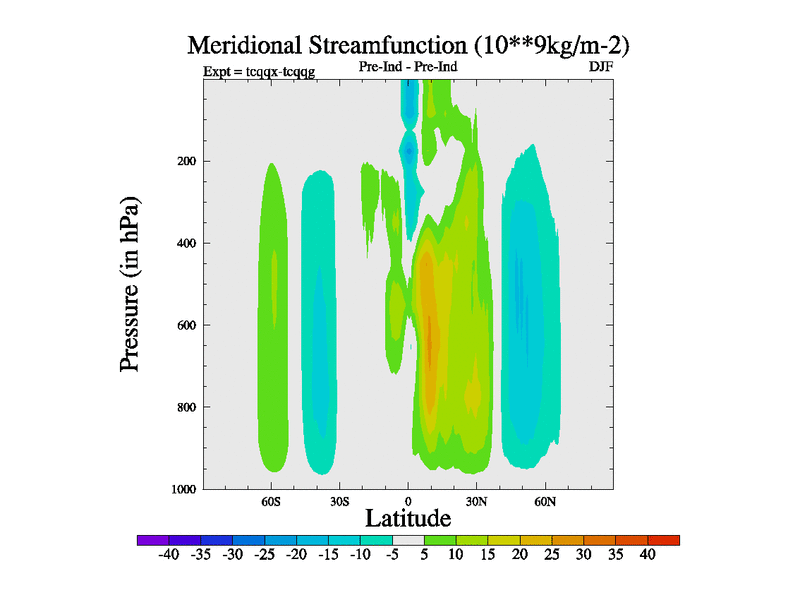
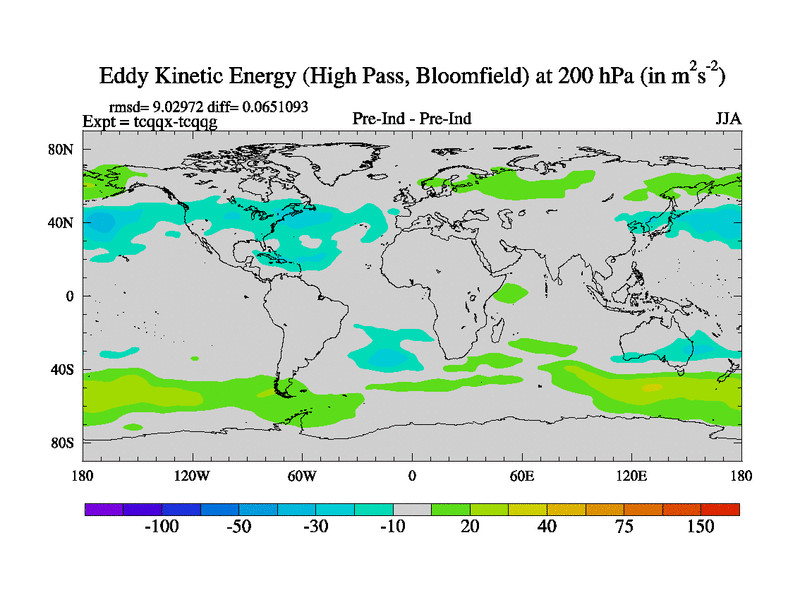
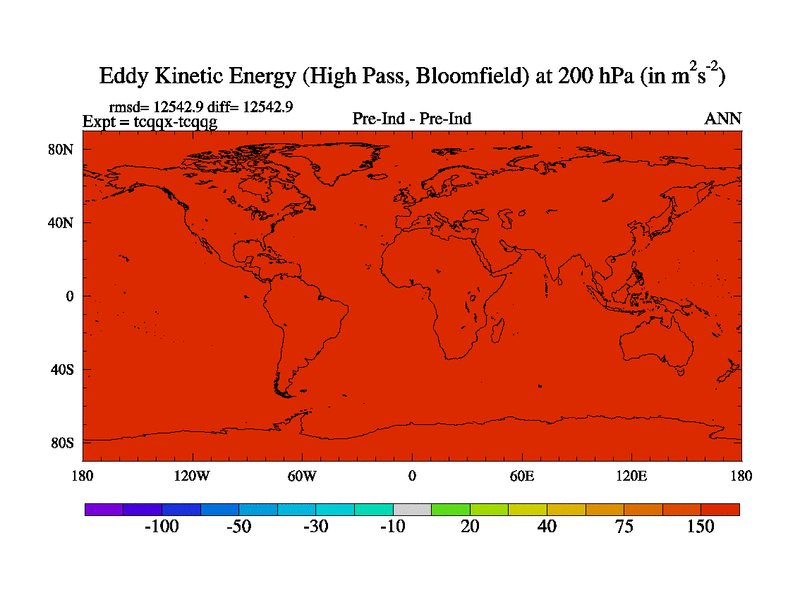
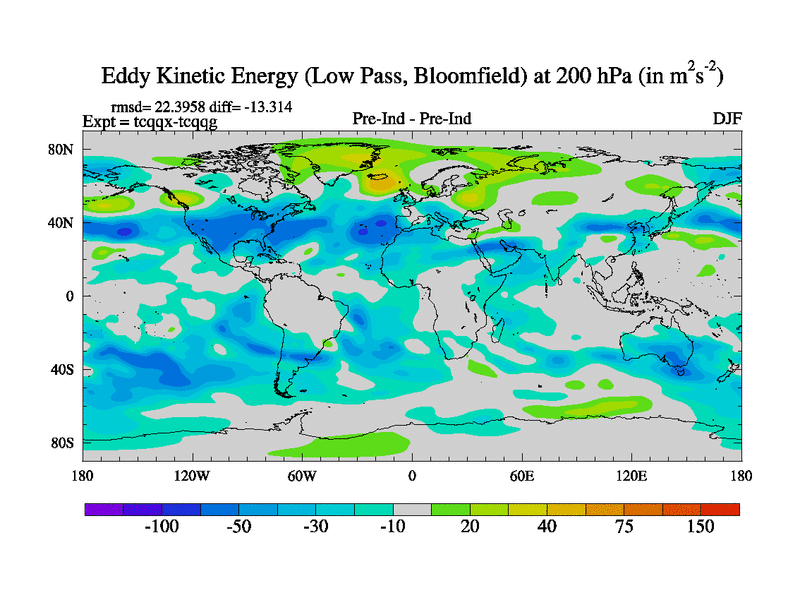
Summary of Results for Experiment tcqqx-tcqqg
Variable
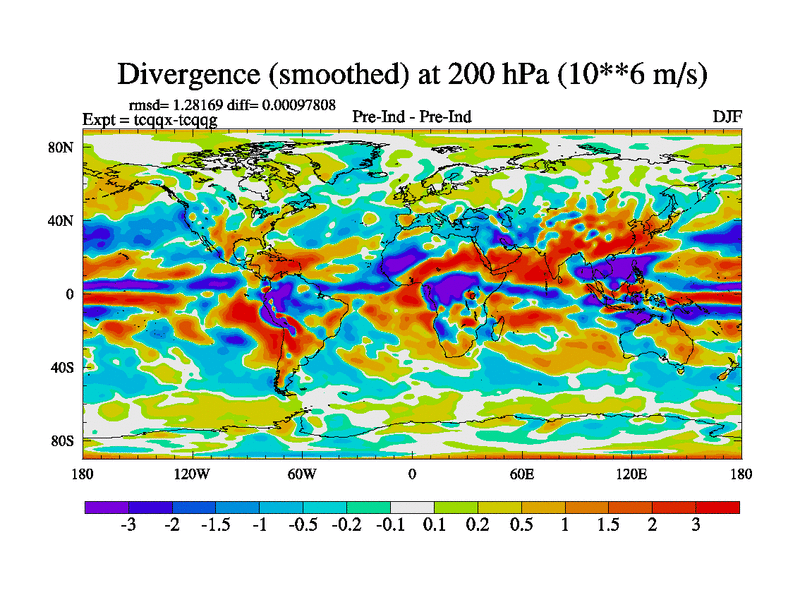
DJF
JJA
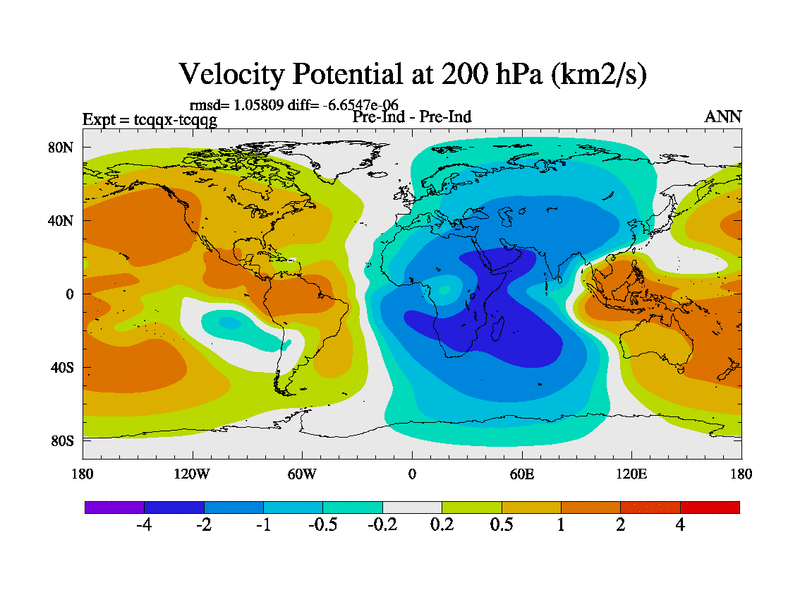
ANN
Monthly
Variable
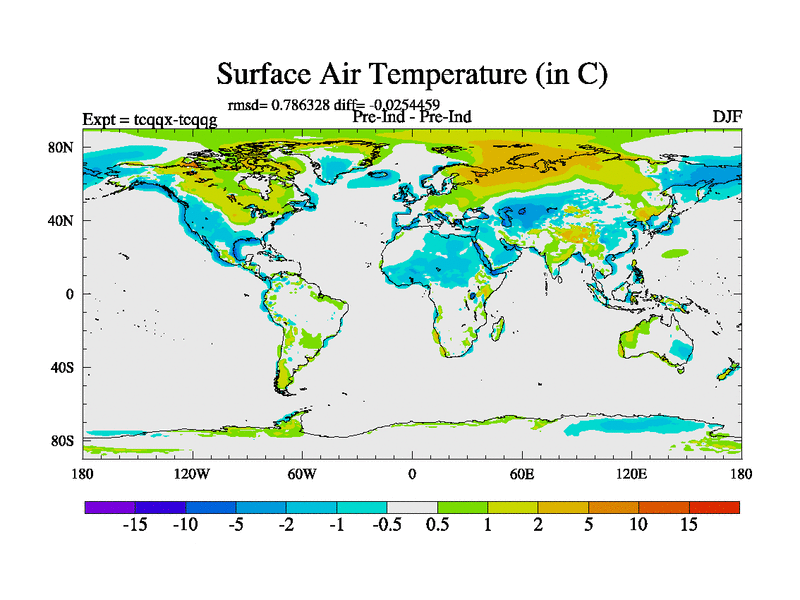
Surface Air Temperature
Surface Air Temperature Time Series
Total Precipitation
Surface Air Temperature Time Series (annual means)
Evaporation
Soil Moisture in Layer 4 (Deepest layer) (annual means)
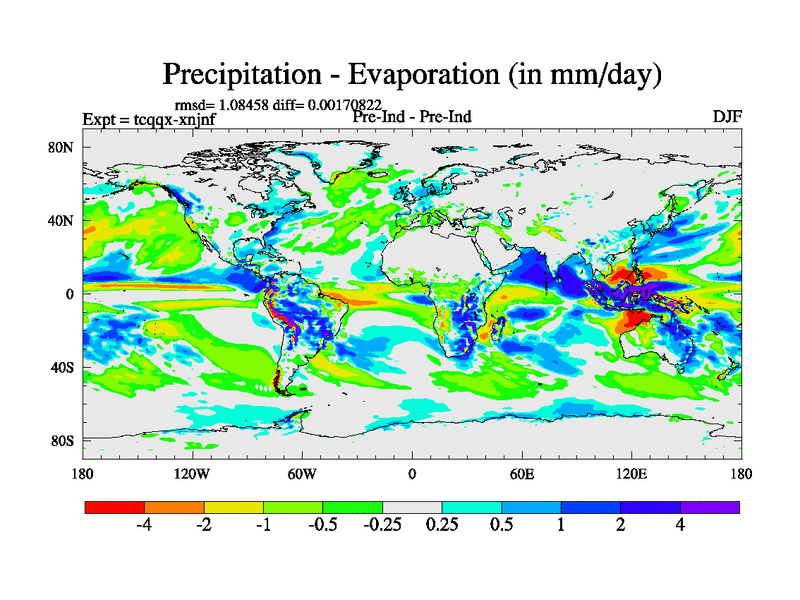
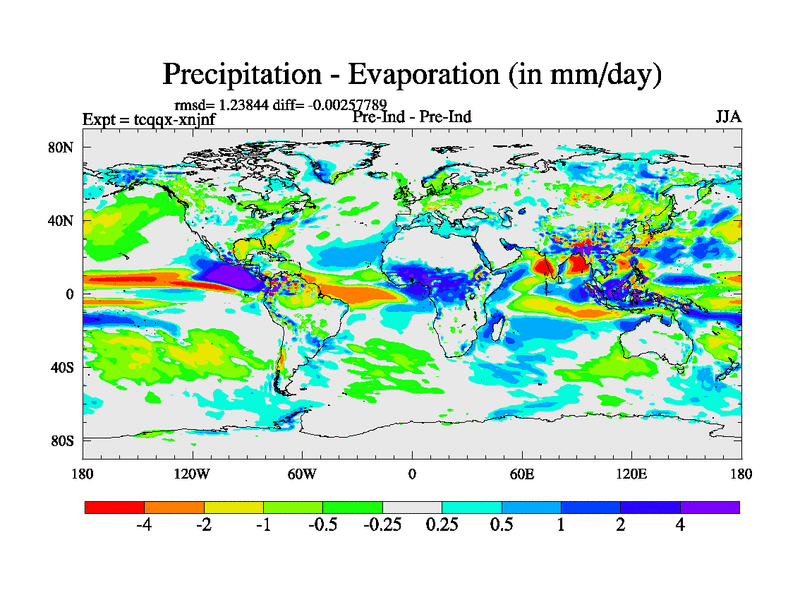
Precipitation - Evaporation
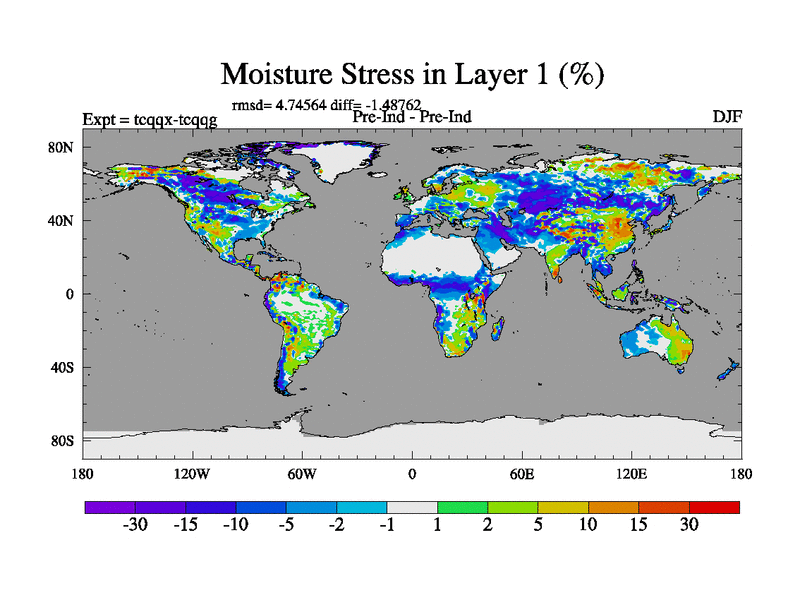
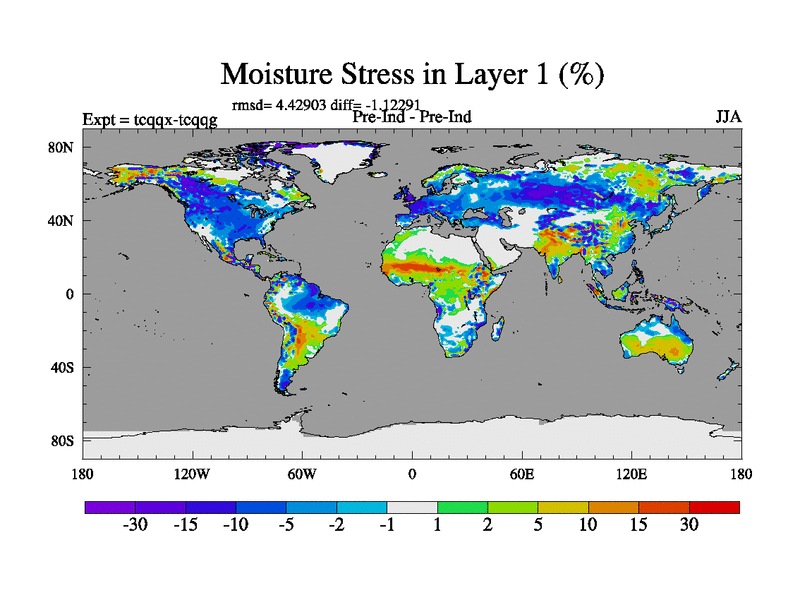
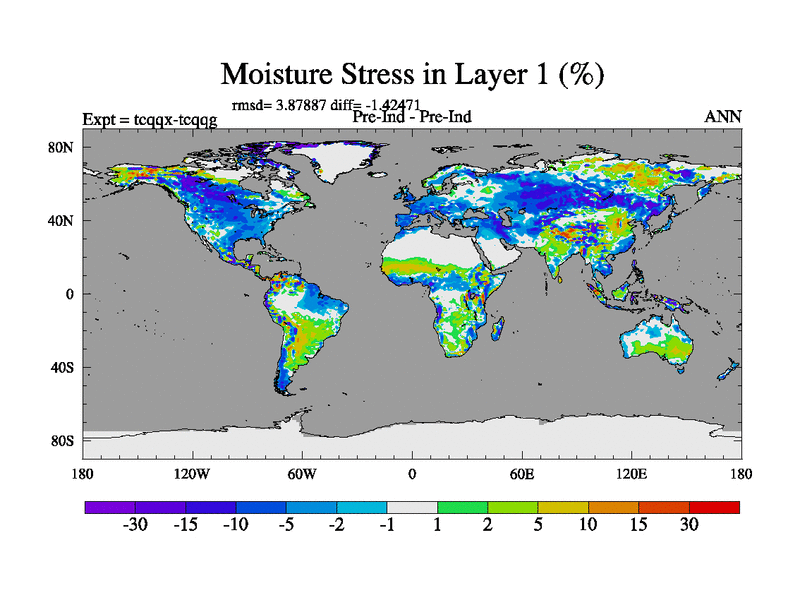
Fractional Plant Stress (layer 1)
BIOME4
Mean Sea Level Pressure
BIOME4 with CO2 changed
Total Cloud Cover
BIOME4 with CO2 changed and anomaly of climate
Plantary Albedo
Warm Month Mean
Surface Albedo
Cold Month Mean
Sea Ice Concentration
Mean Annual Temperature Cycle
Stream Function at 200 hPa
Mean Annual Precipitation Cycle
Velocity Potential at 200 hPa
Divergence (Smoothed) at 200 hPa
Perturbation Height at 500 hPa
Meridional Stream Function
High Pass Eddy Kinetic Energy at 200 hPa
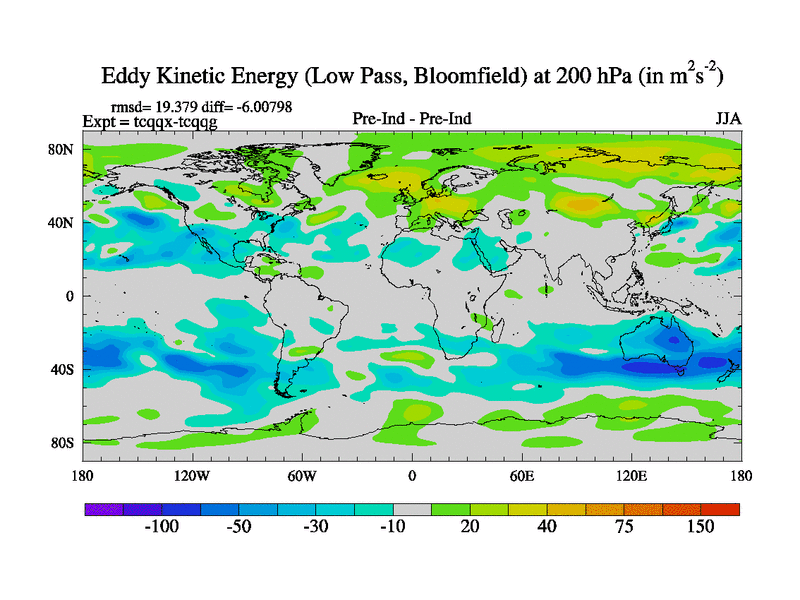
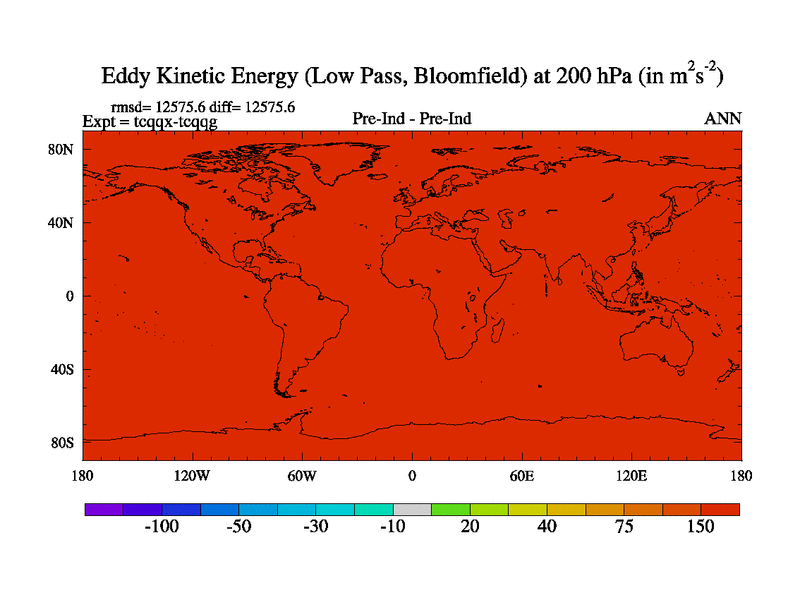
Low Pass Eddy Kinetic Energy at 200 hPa
High Pass Temperature Flux at 850 hPa
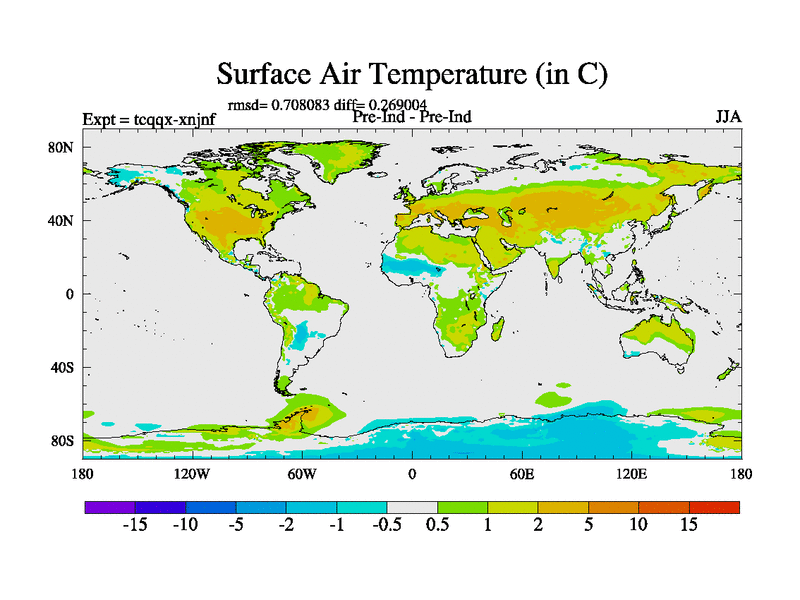
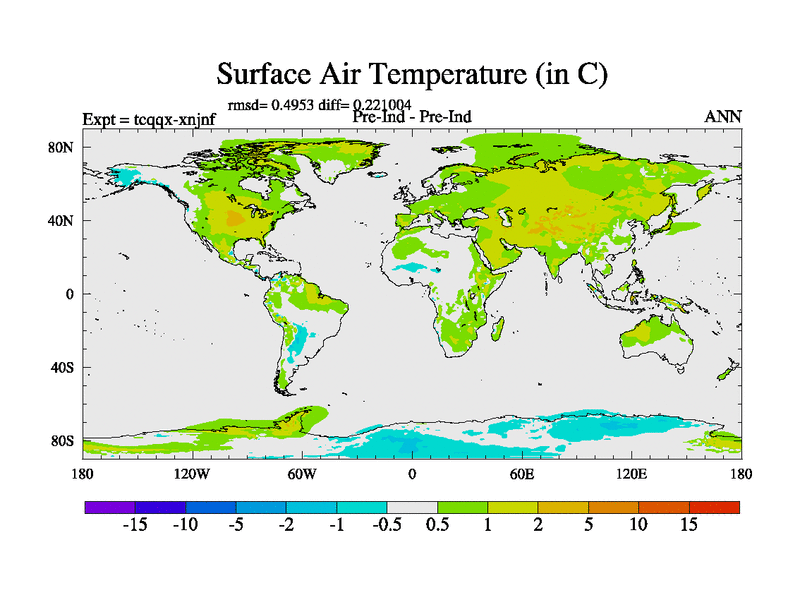
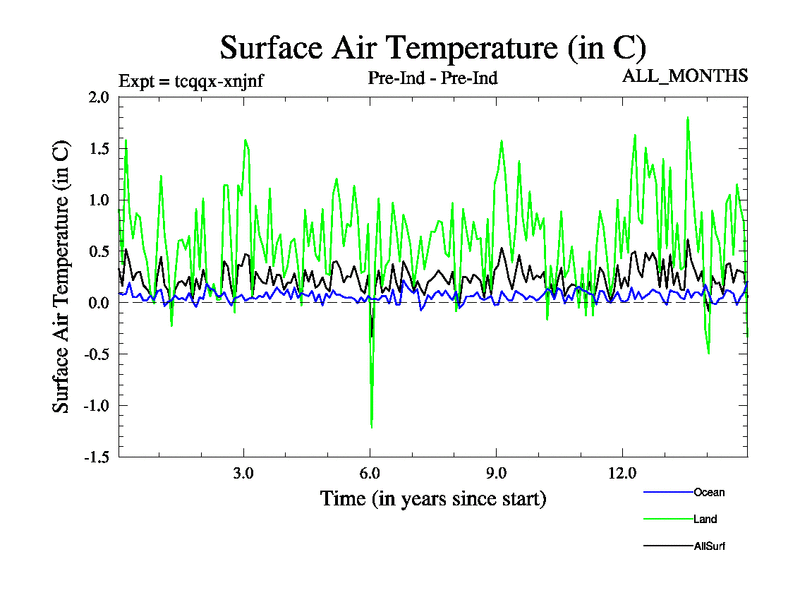
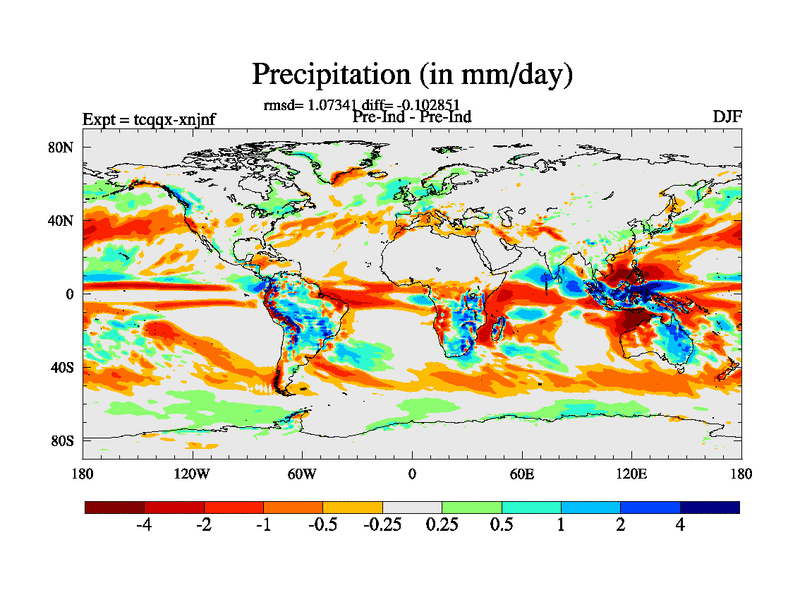
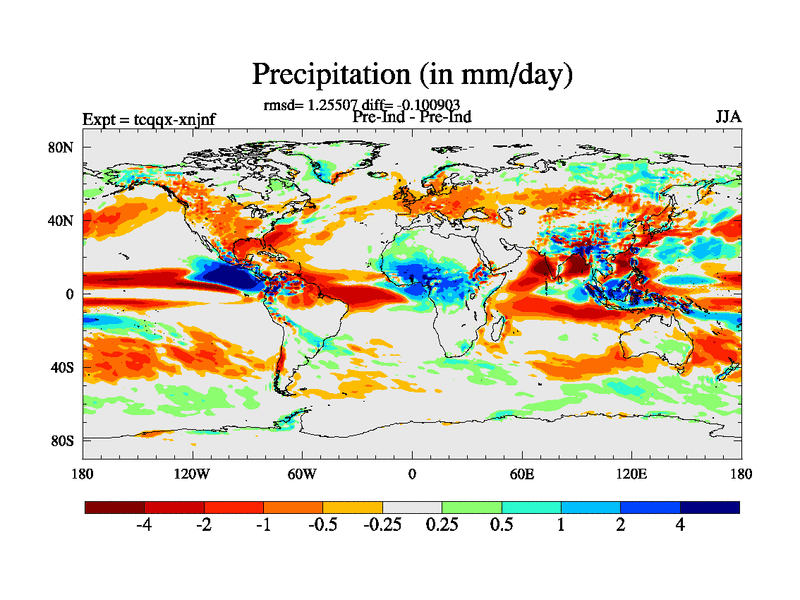
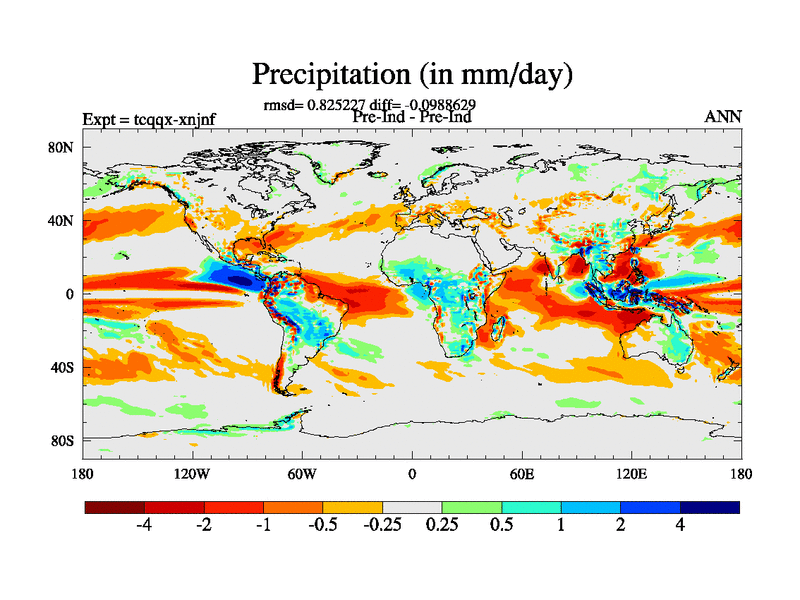
Summary of Results for Experiment tcqqx-xnjnf
Variable
DJF
JJA
ANN
Monthly
Variable
Surface Air Temperature
Surface Air Temperature Time Series
Total Precipitation
Surface Air Temperature Time Series (annual means)
Evaporation
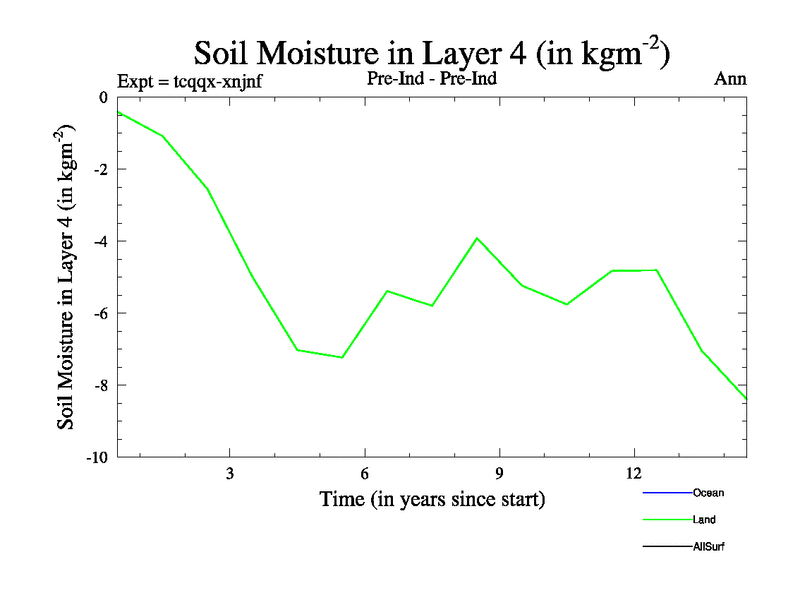
Soil Moisture in Layer 4 (Deepest layer) (annual means)